

How we measure performance
We use two complaint sources to gain insight into the performance of companies;
- complaints received directly by retailers; and
- complaints raised directly to CCW about companies.
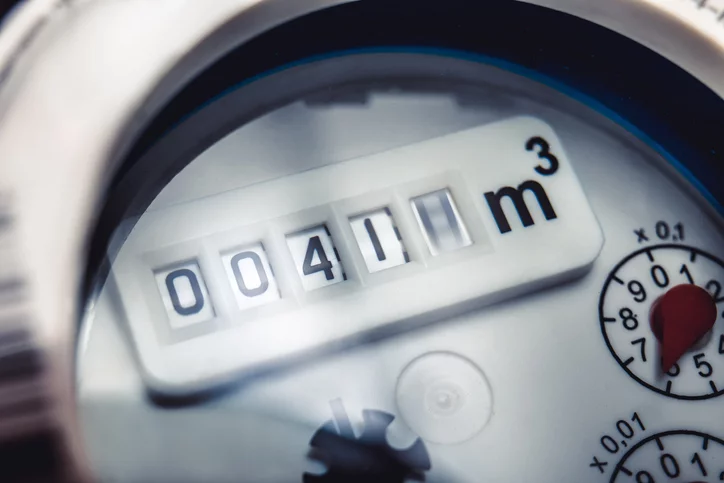
To make sure complaints are fair for all retailers, we use something called a Supply Point ID (SPID). The measure we use to do this is ‘complaints per 10,000 supply points’. For example:
- Total complaints: 600
- Total supply points: 4,000,000
- Complaints per 10,000 supply points = 600/4,000,000 x 10,000 = 1.5
How we compare performance
We recognise that for smaller retailers, each complaint can make performance appear disproportionately poor. We categorise retailers based upon their size in the following way;
- smaller retailers – less than 5,000 supply points; and
- larger retailers – more than 5,000 supply points.
In this industry, almost 99% of it is controlled by big retailers. Complaints about smaller retailers are quite rare, with only five reported to CCW in 2023-24. Because of this, we handle larger retailers separately from the smaller ones. We use the median and quartiles as our main ways to understand trends among the big retailers. When it comes to the smaller retailers, we rely more on detailed explanations and stories to analyse what’s happening.
We measure performance by complaints per 10,000 SPIDs and colour code them as follows:
| How we measure |
|---|
| Good |
| Better than median* |
| At or worse than median* |
| Poor |
*Median – a mid-point of the data set, or a middle value in the list of numbers that are arranged by highest to lowest.
Larger retailer’s performance in 2025-26 (April 2025 to March 2026)
| Company | Number of SPIDs | Total complaints per 10,000 SPIDs | Complaints to CCW per 10,000 SPIDs |
|---|---|---|---|
| ADSM | 10689 | 0.0 | 0.0 |
| Business Stream | 390128 | 61.14 | 7.37 |
| Castle Water | 441209 | 100.49 | 18.26 |
| Clear Business Water | 24216 | 359.97 | 20.42 |
| Dŵr Cymru Welsh Water** | 195249 | 51.99 | 1.23 |
| Everflow | 192890 | 37.58 | 6.73 |
| Pozitive Water Limited | 15063 | 43.22 | 1.29 |
| Hafren Dyfrdwy** | 8889 | 14.74 | 2.27 |
| SES Business Water | 33568 | 142.79 | 21.55 |
| Source for Business | 151406 | 15.80 | 4.17 |
| Water Plus | 697158 | 107.32 | 9.29 |
| Water2Business | 182793 | 38.80 | 0.87 |
| Wave | 393404 | 43.54 | 6.11 |
**Only business customers in Wales who use 50 megalitres of water per year are allowed to access the retail market and choose their water retailer. The above numbers for Dŵr Cymru Welsh Water and Hafren Dyfrdwy relates to the total number of SPIDs and not just those in the open retail market. The majority of business customers in Wales continue to receive retail services from Dŵr Cymru Welsh Water or Hafren Dyfrdwy.
Small retailers’ performance in 2025-26 (April 2025 to March 2026)
We’re unable to colour code small retailers’ performance due to small number of complaints.
| Company | Number of SPIDs | Complaints to retailer | Complaints to CCW |
|---|---|---|---|
| ConservAqua | 4,276 | Total complaints: 3
Complaints per 10,000 supply points: 7.02 |
Total complaints: 2
Complaints per 10,000 supply points: 4.68 |
| The Water Retail Company | 2,209 | Total complaints: 0
Complaints per 10,000 supply points: 0.0 |
Total complaints: 0
Complaints per 10,000 supply points: 0.0 |
| Smarta Water | 2,244 | Total complaints: 9
Complaints per 10,000 supply points: 40.11 |
Total complaints: 8
Complaints per 10,000 supply points: 35.65 |
| Veolia Retail | 739 | Total complaints: 0
Complaints per 10,000 supply points: 0.0 |
Total complaints: 0
Complaints per 10,000 supply points: 0.0 |
| Yu Water | 946 | Total complaints: 33
Complaints per 10,000 supply points: 348.84 |
Total complaints: 5
Complaints per 10,000 supply points: 52.85 |
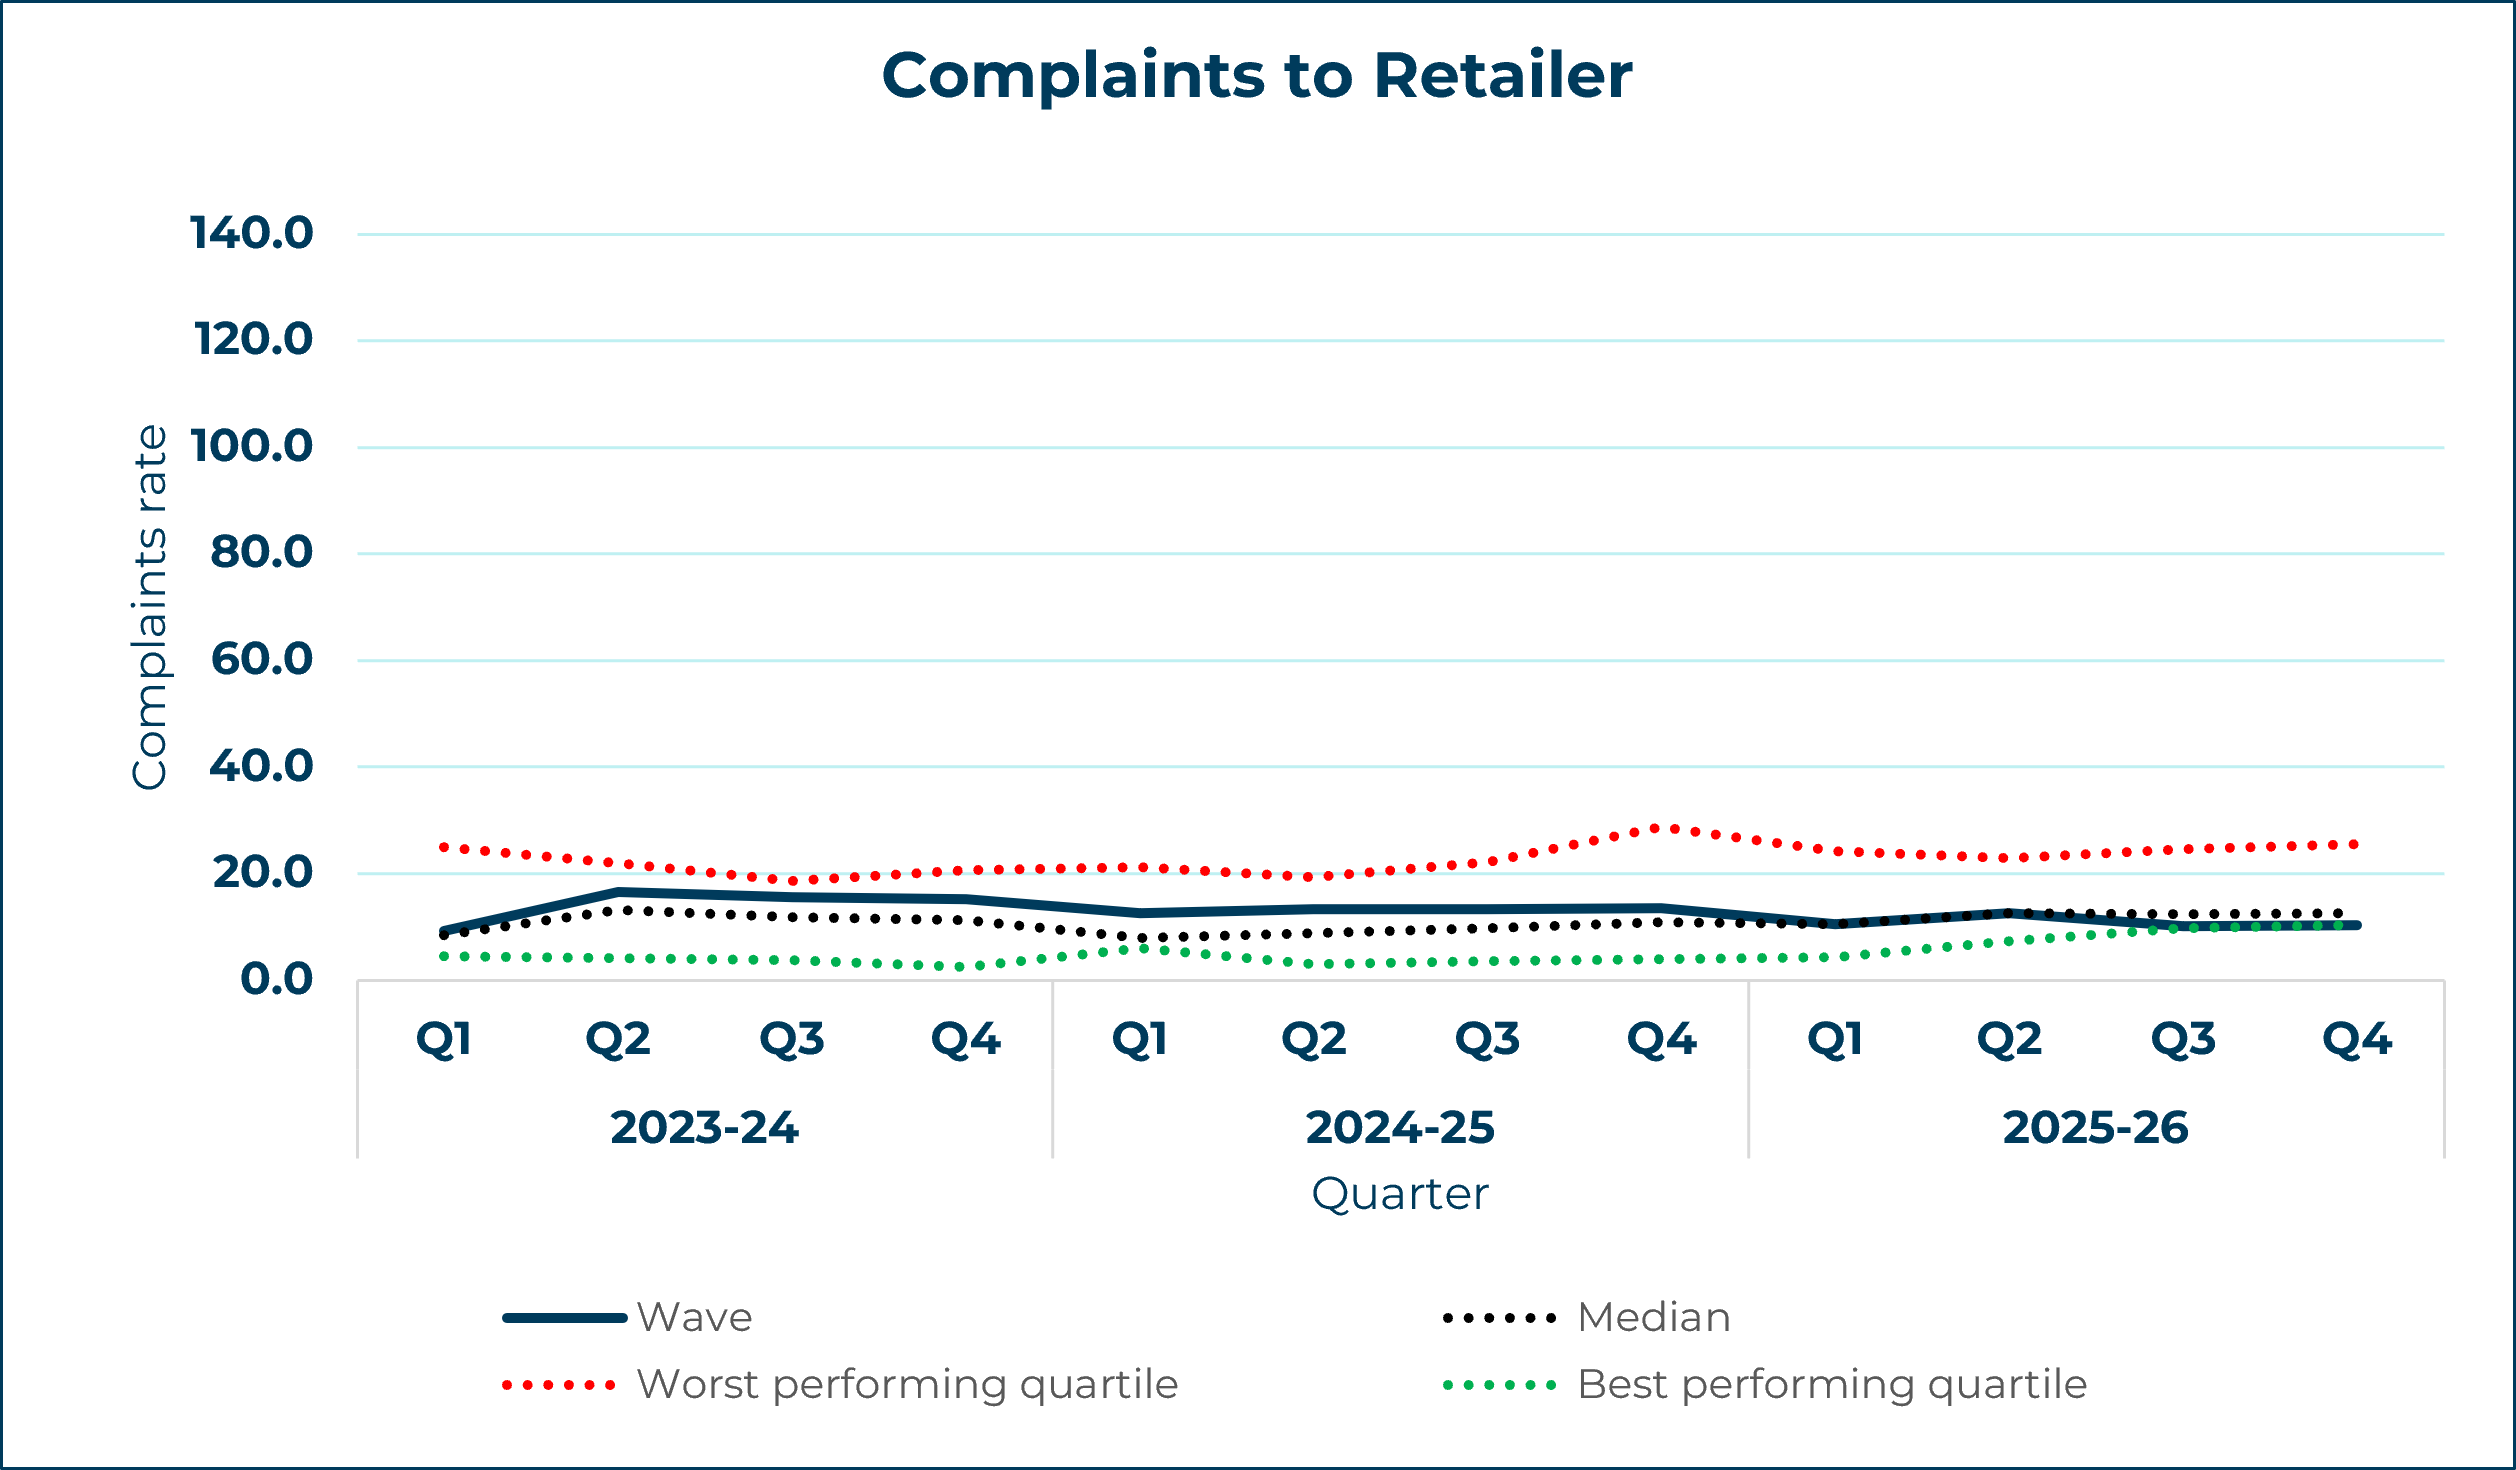
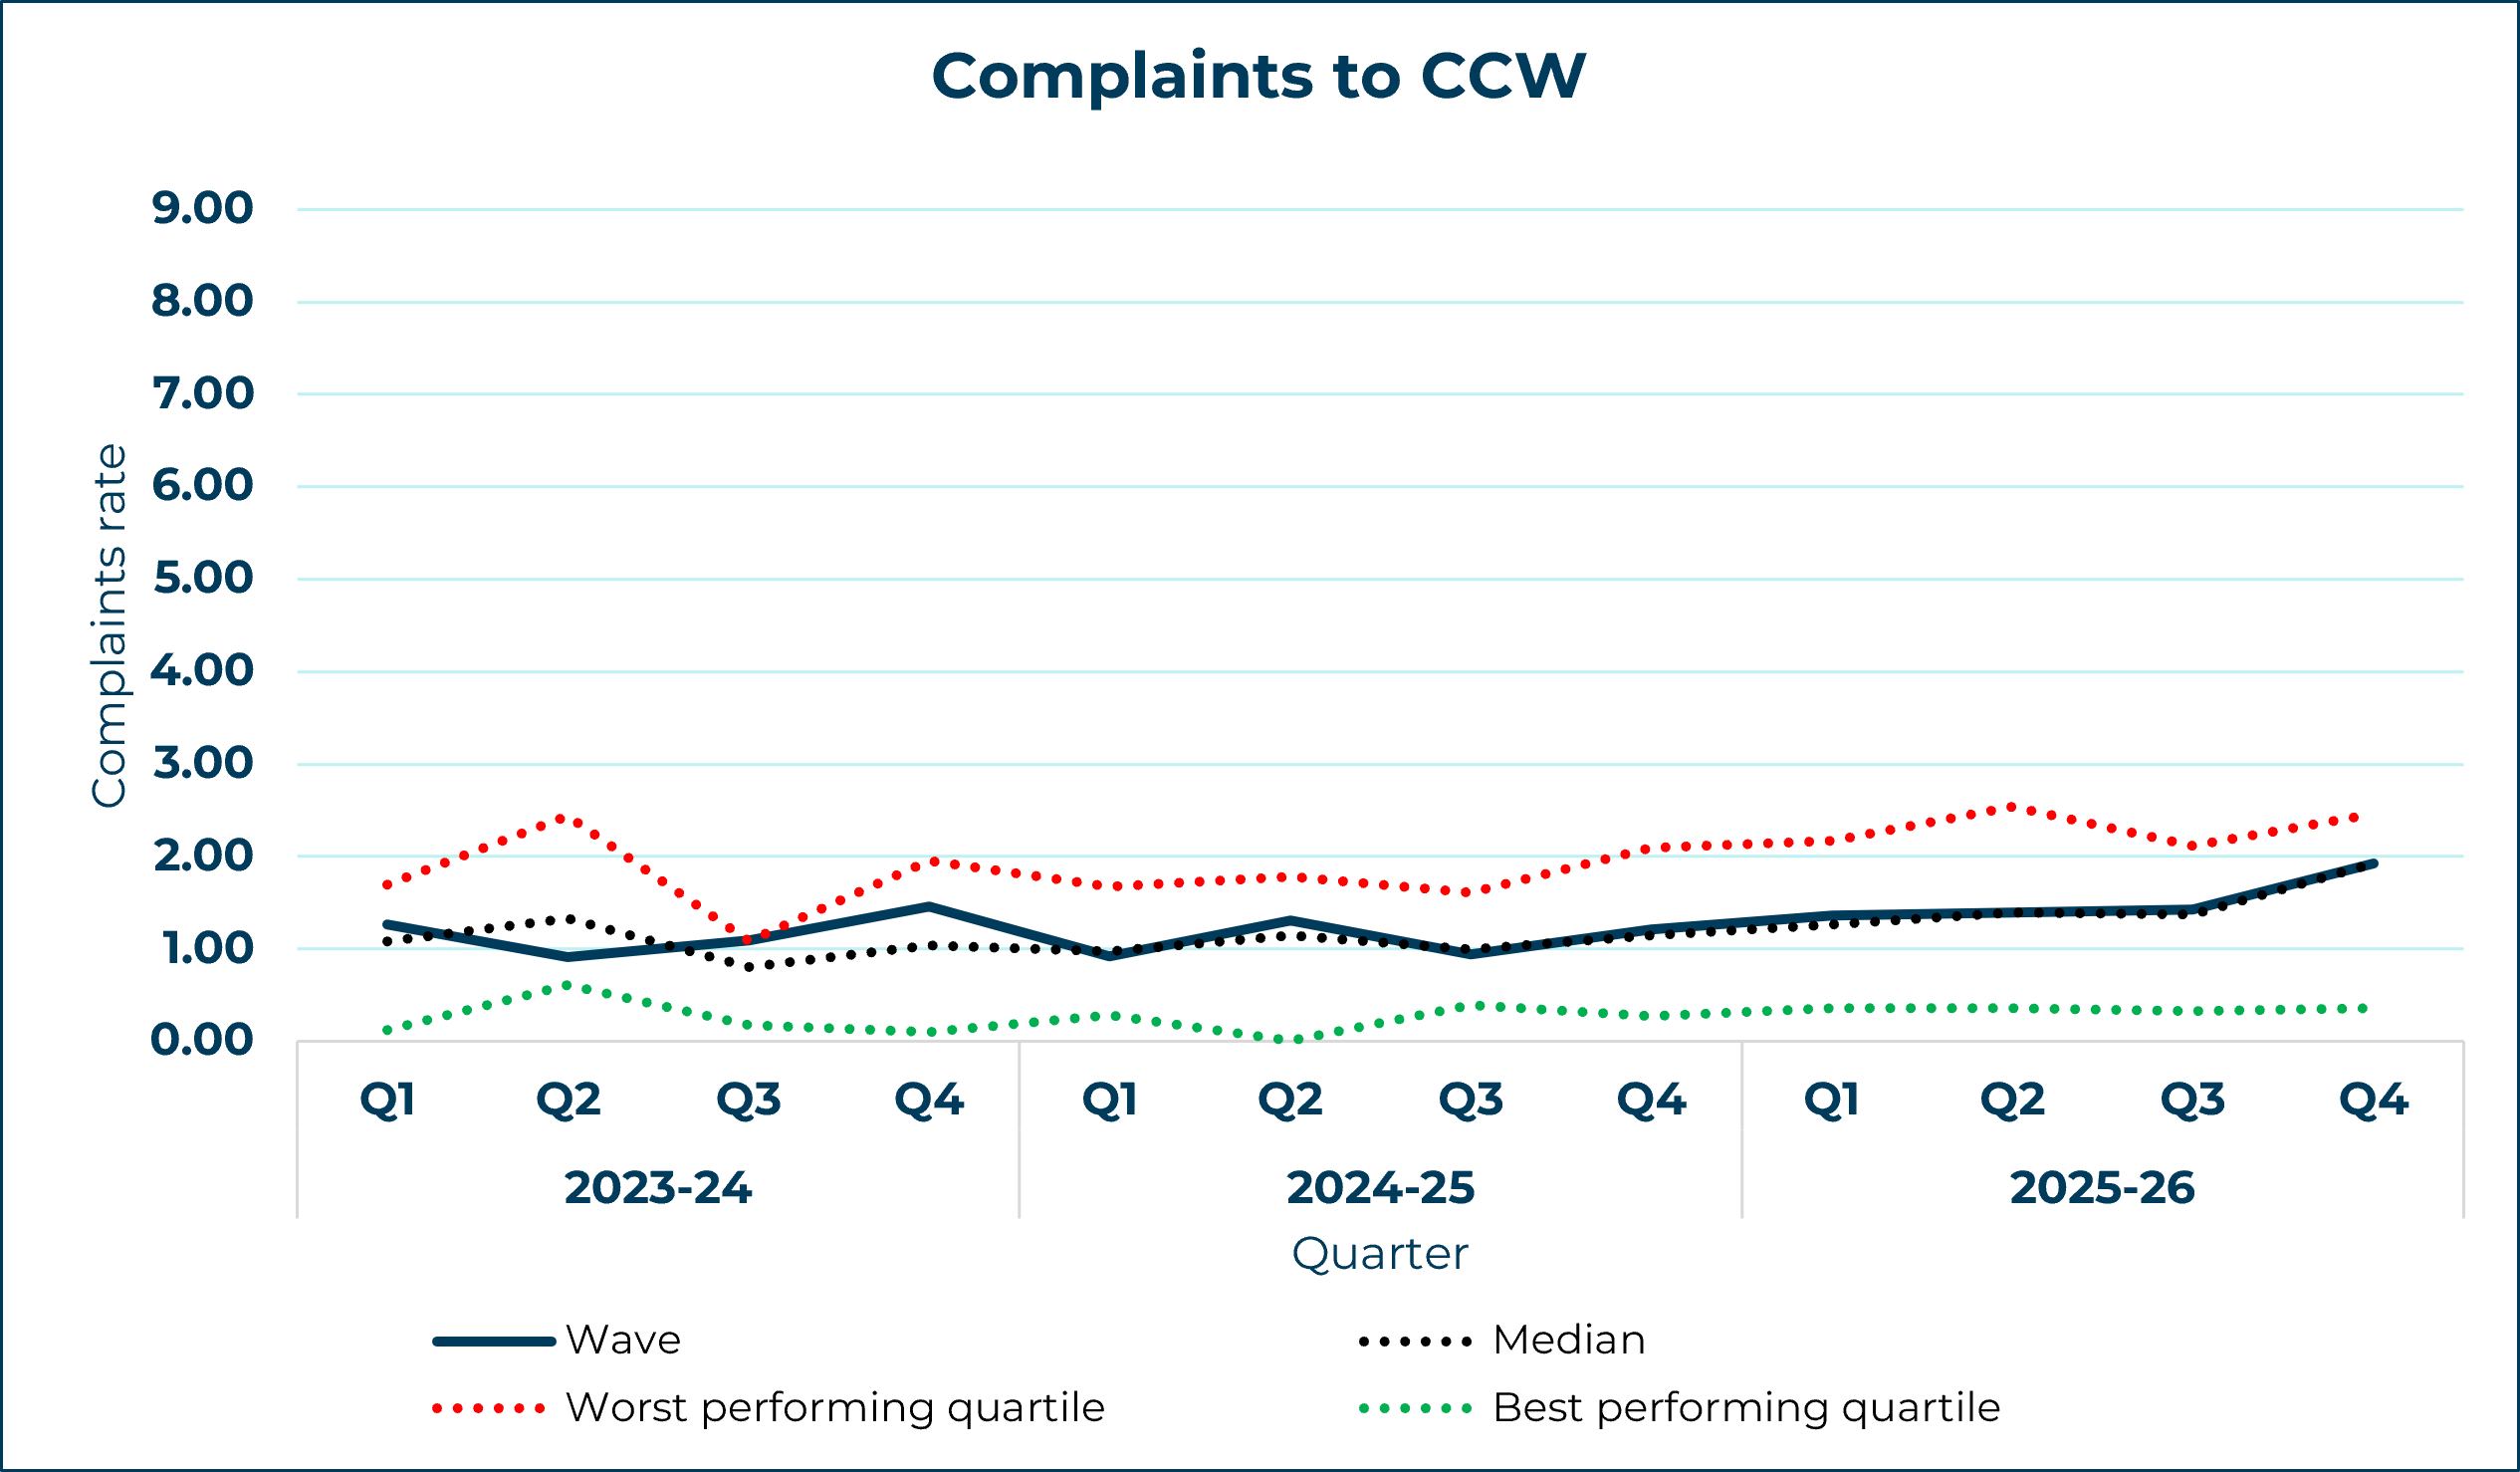
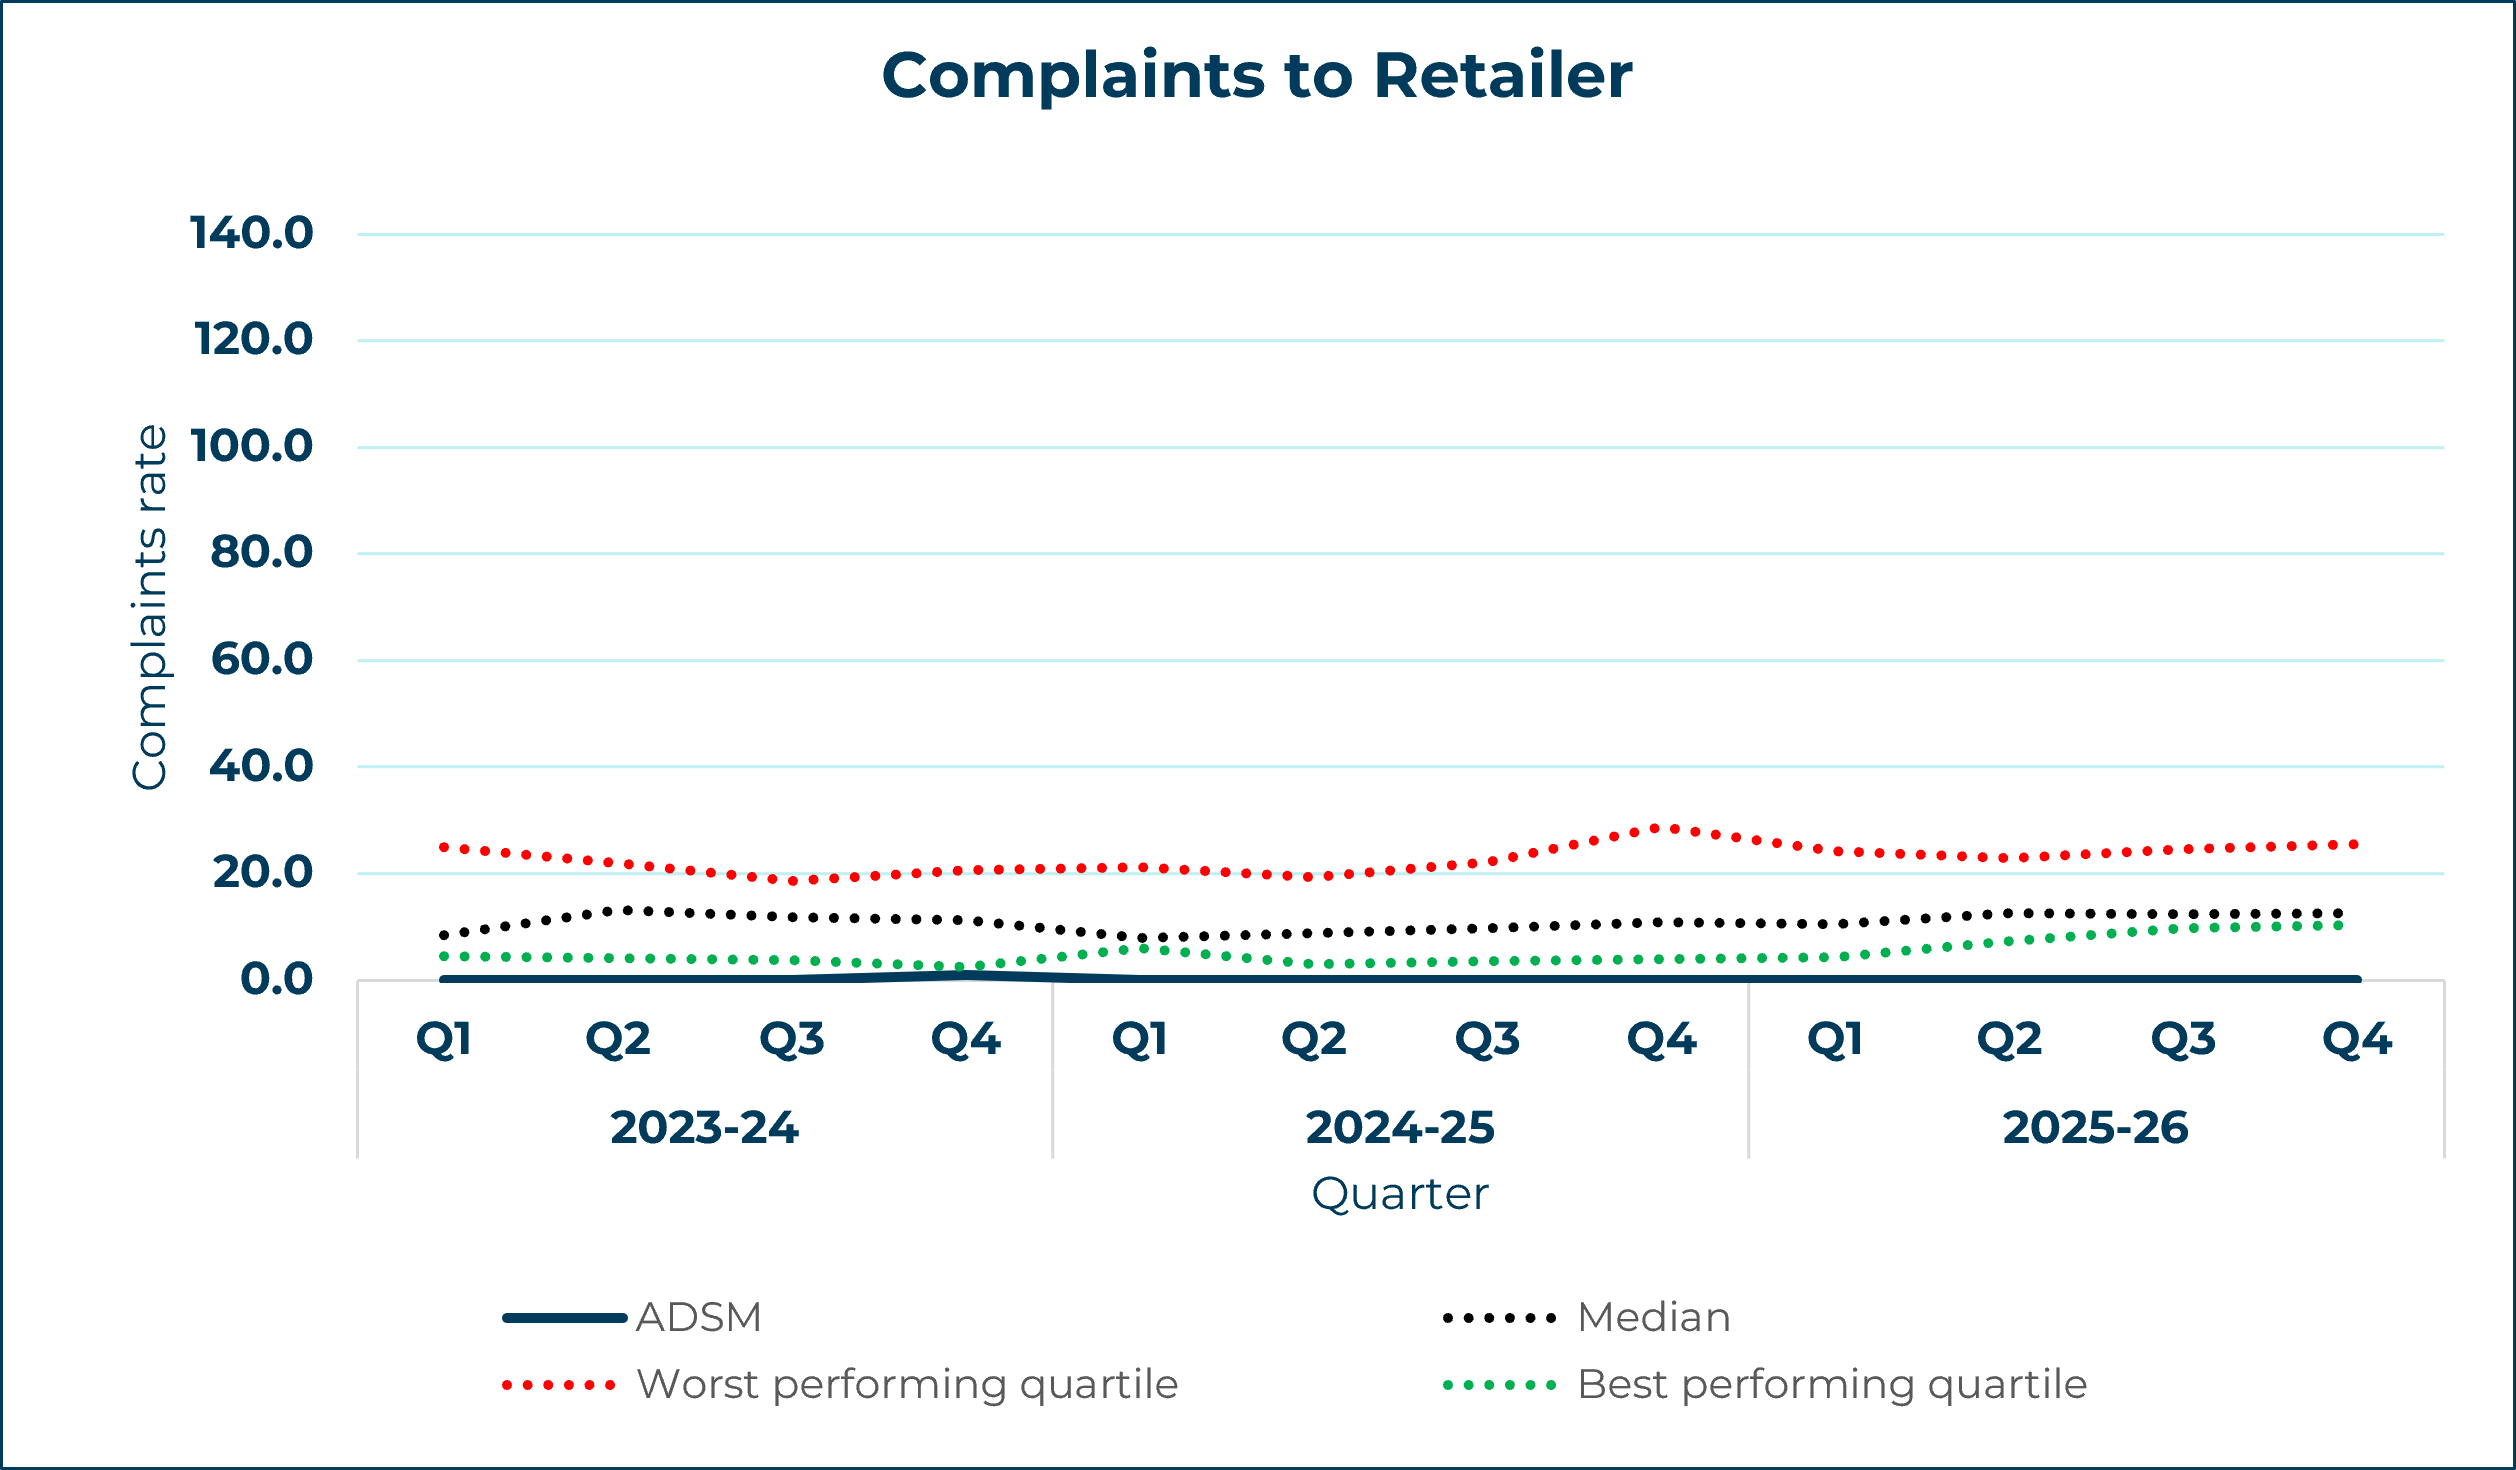
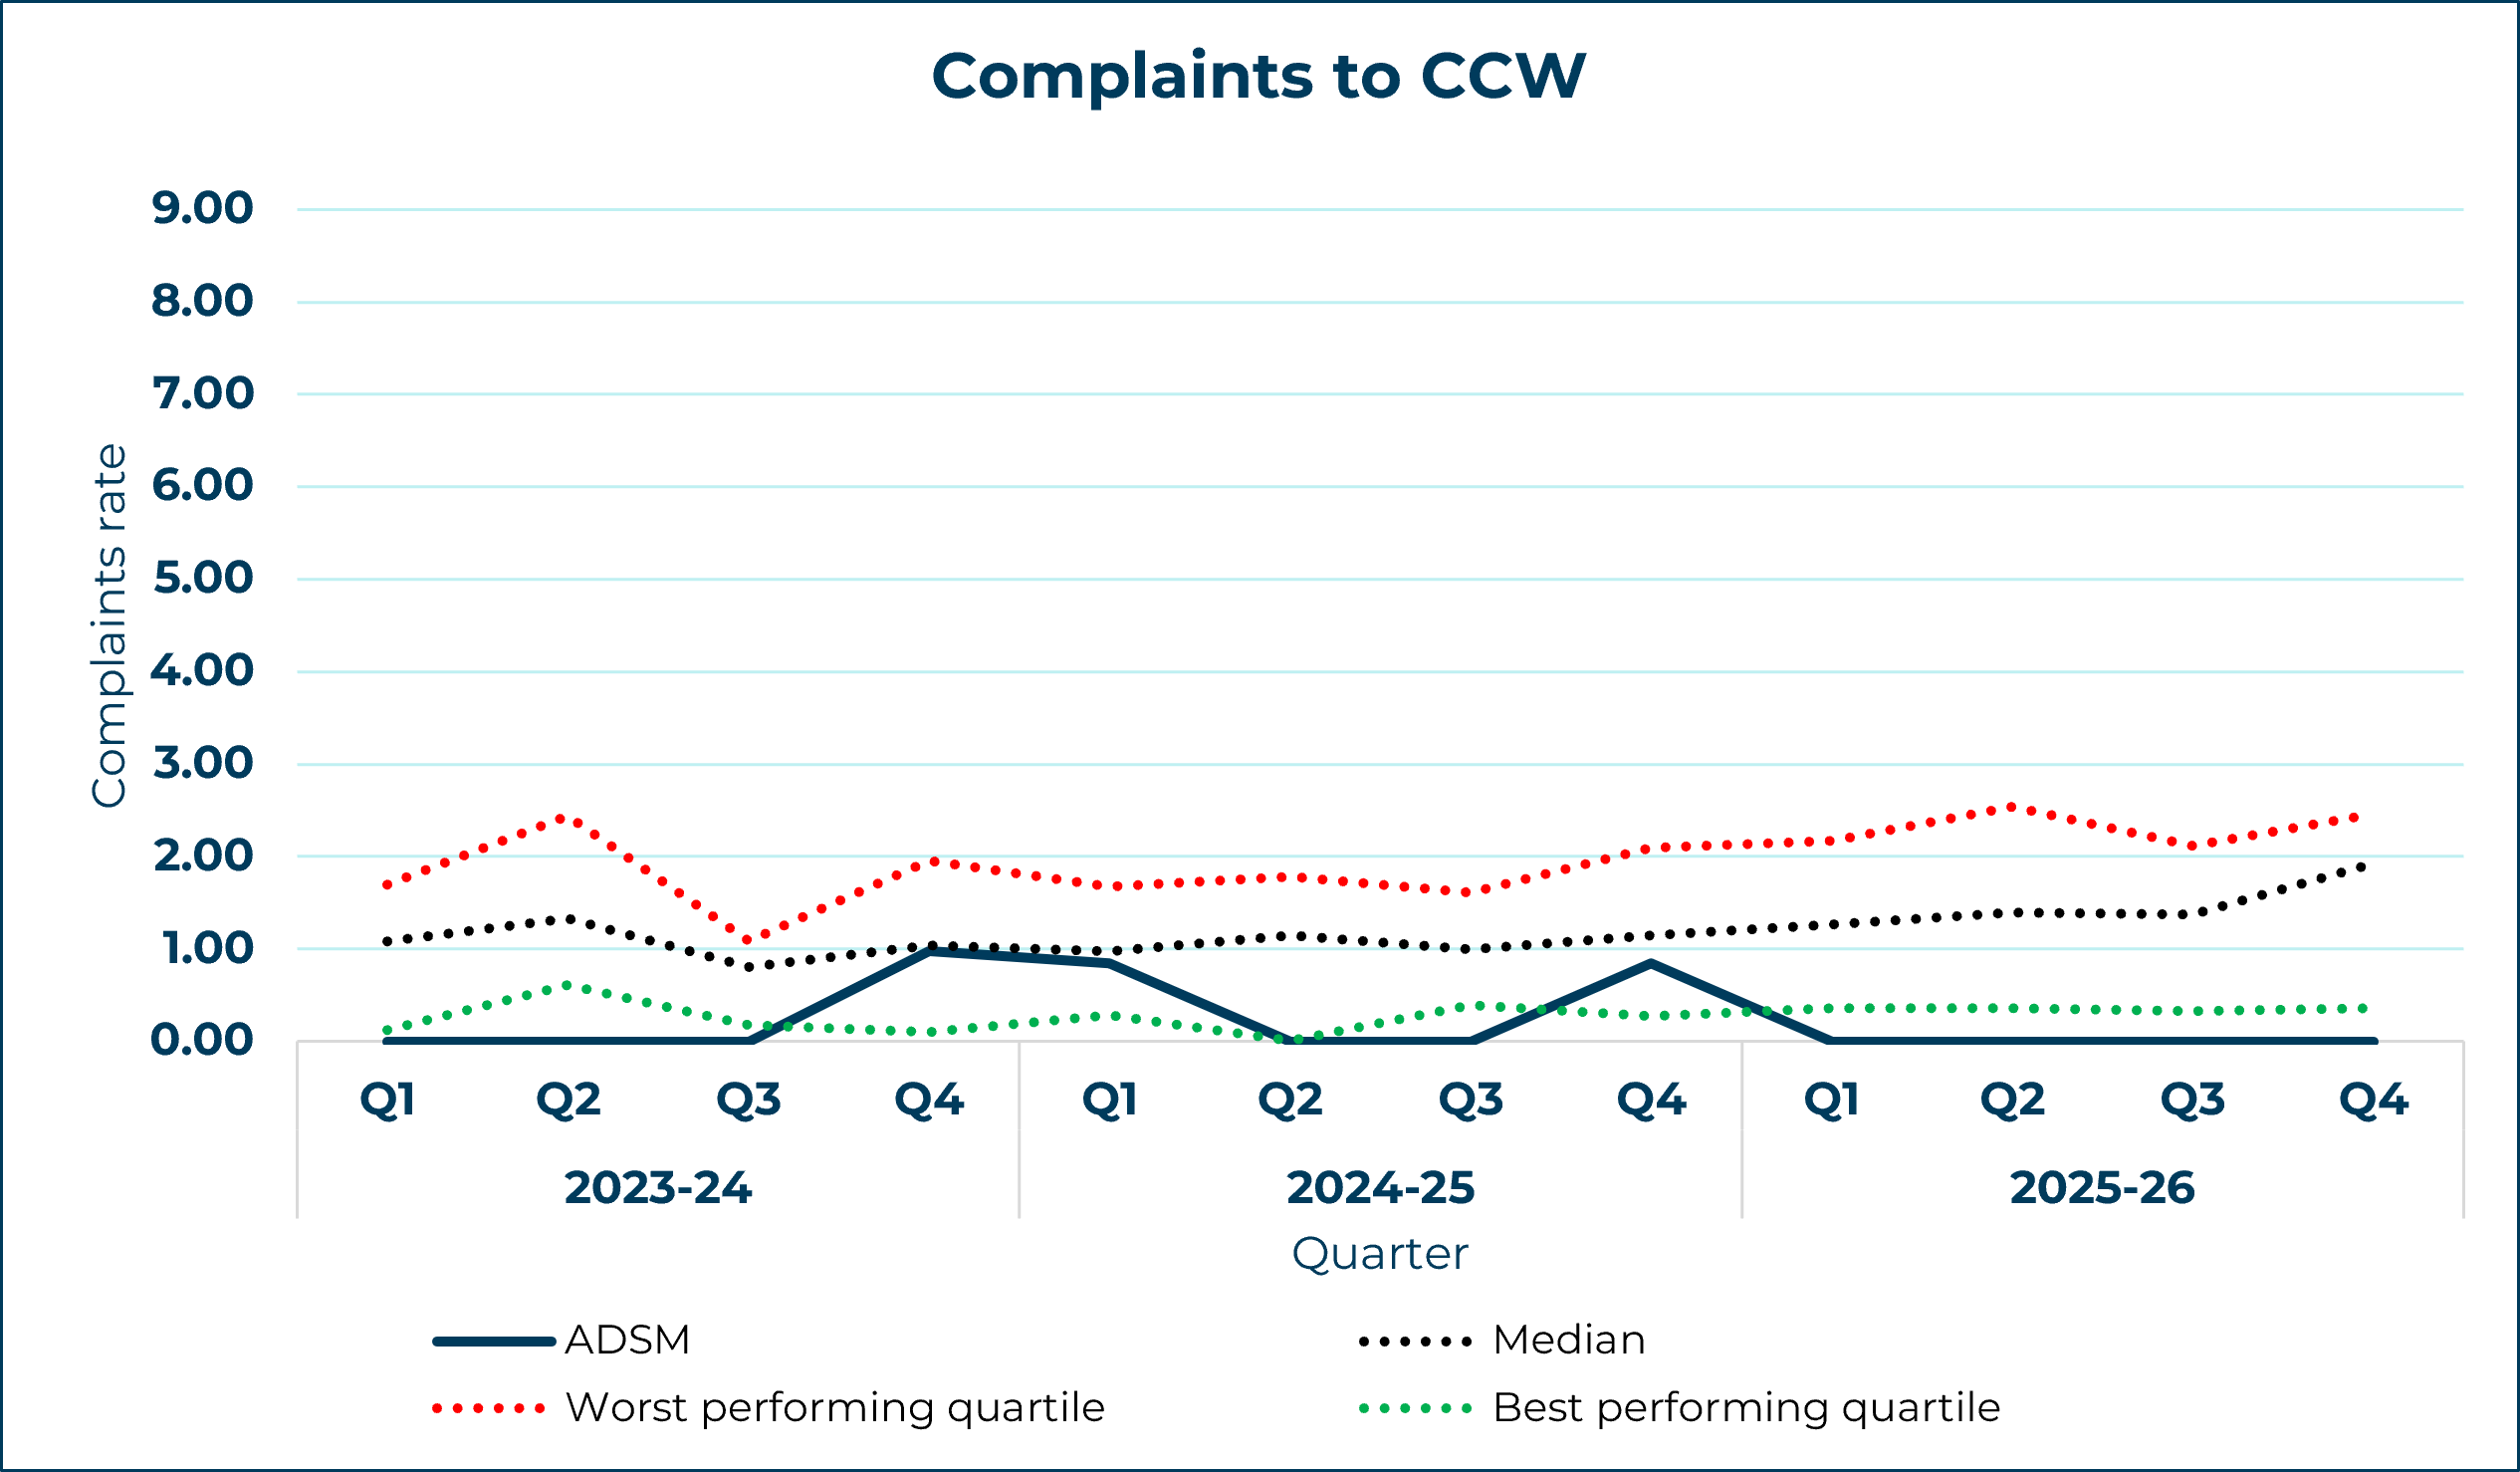
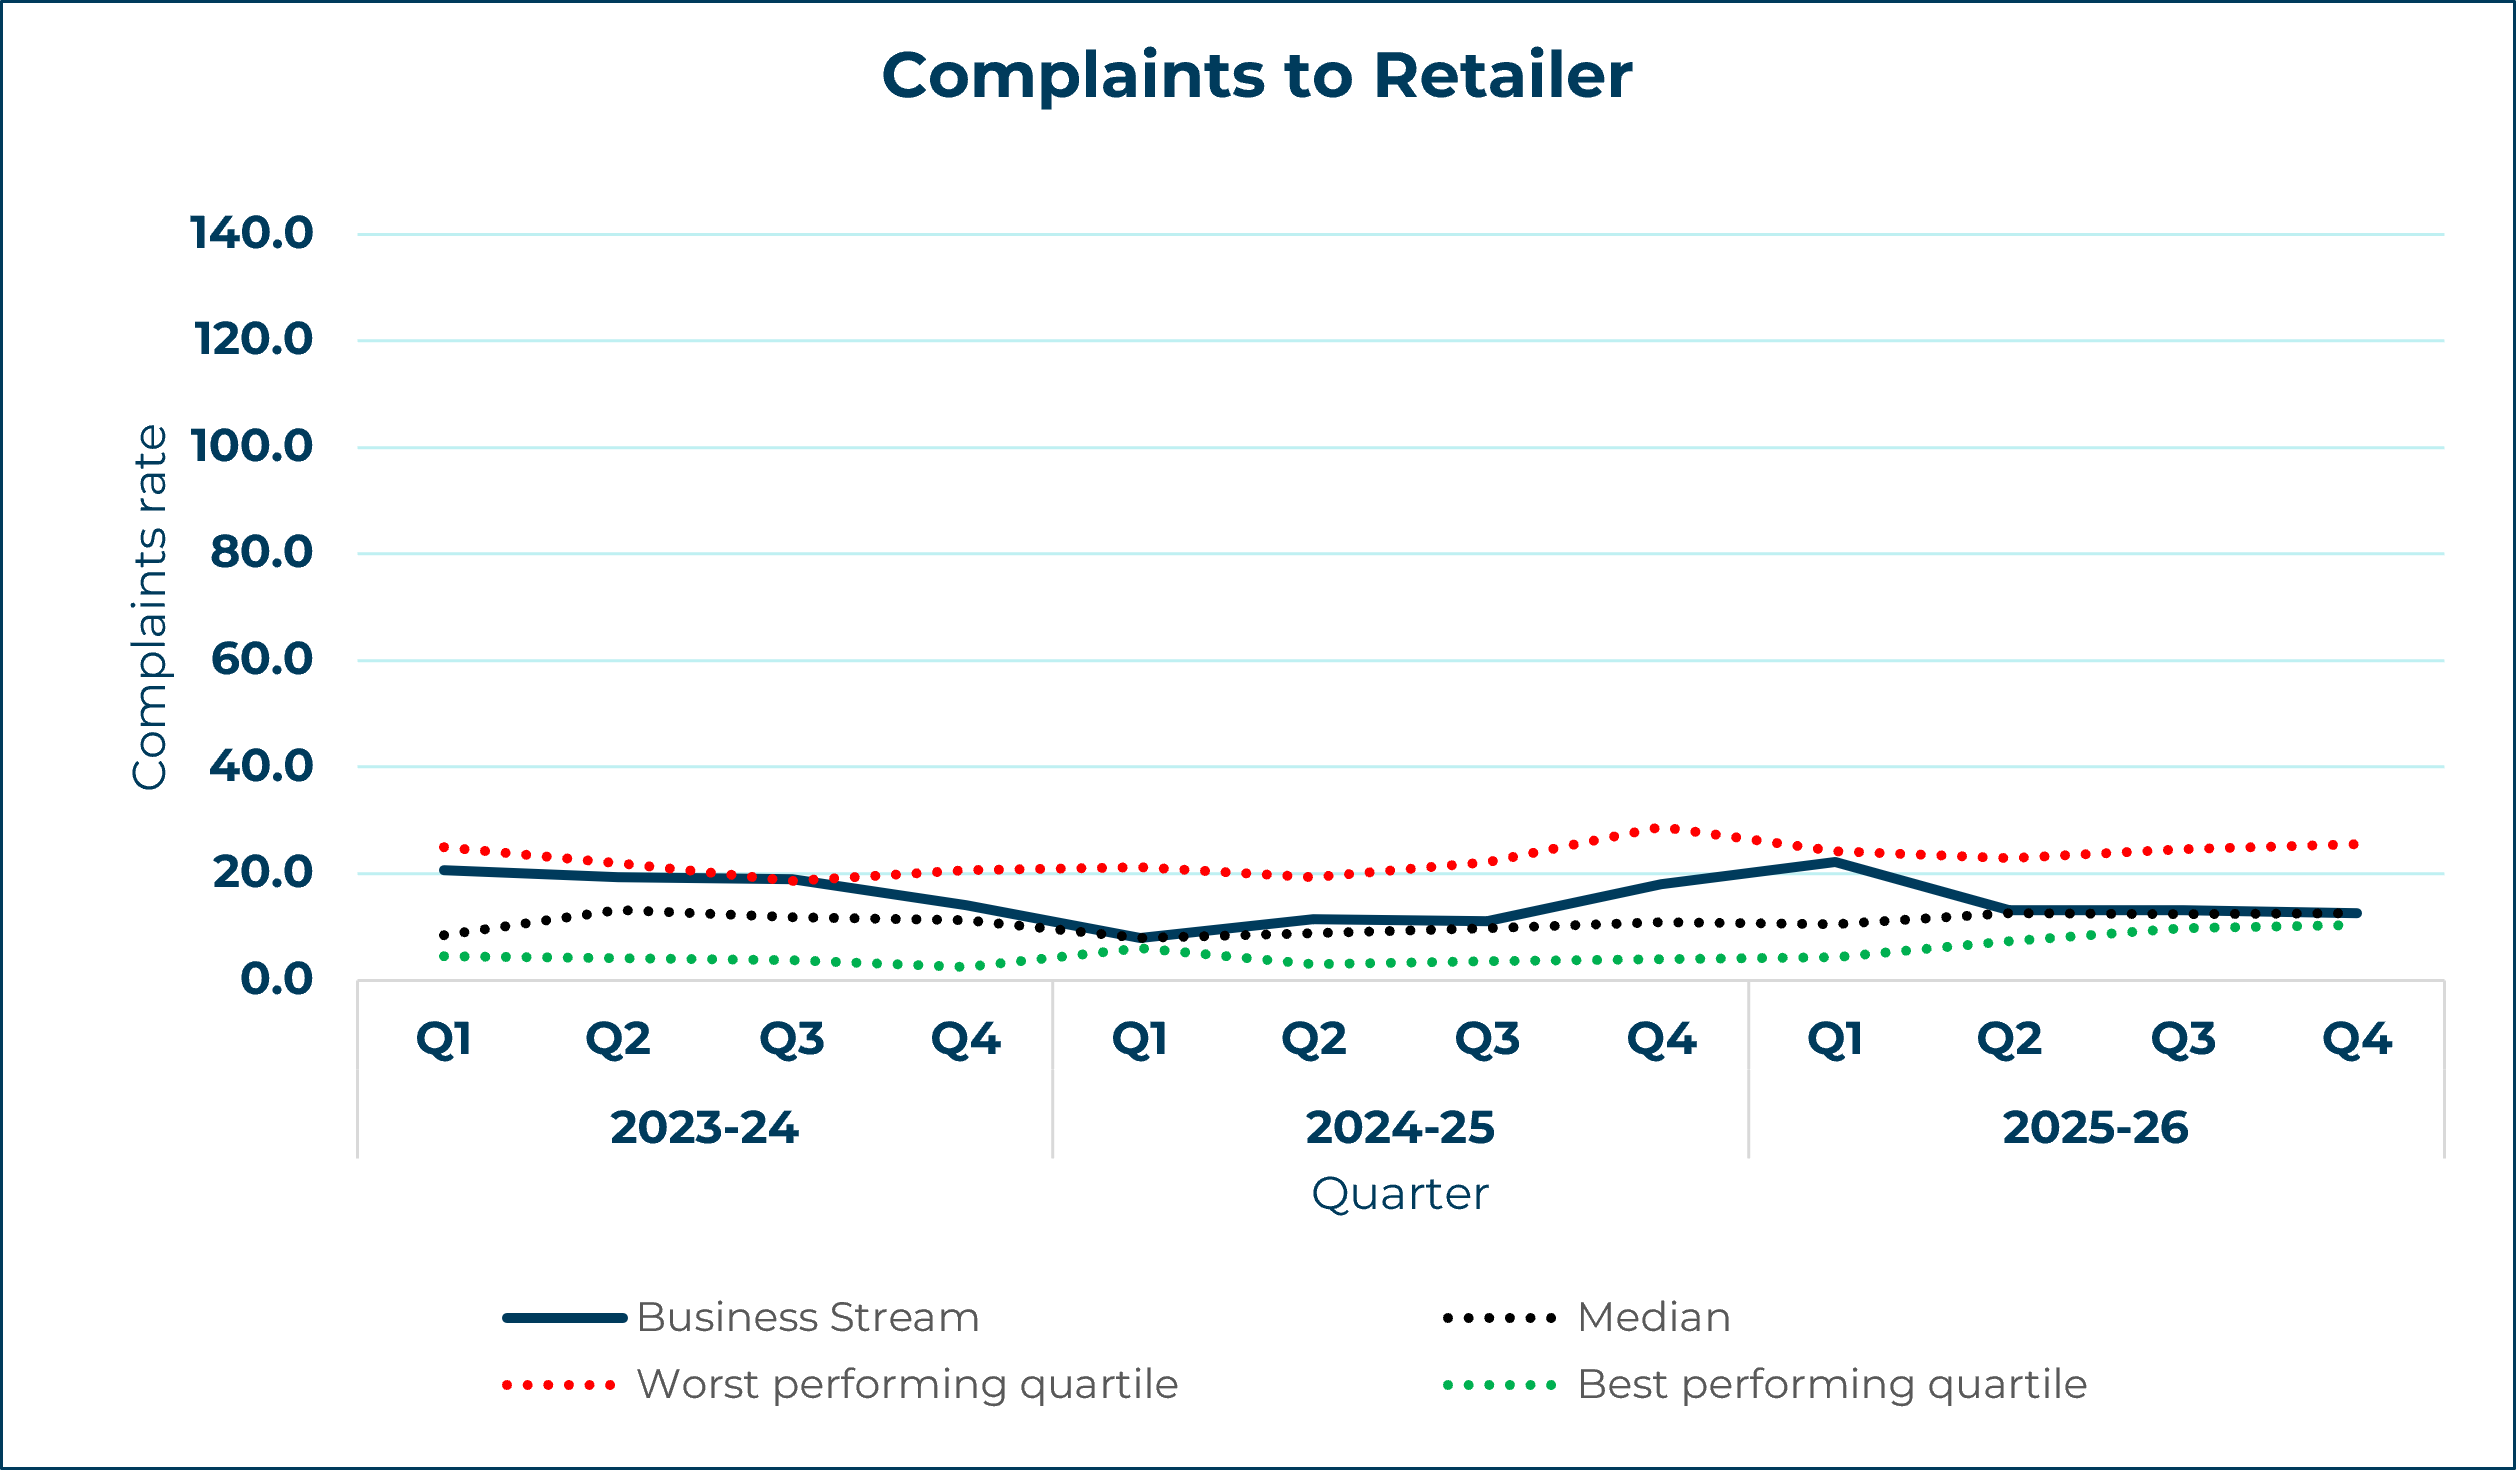
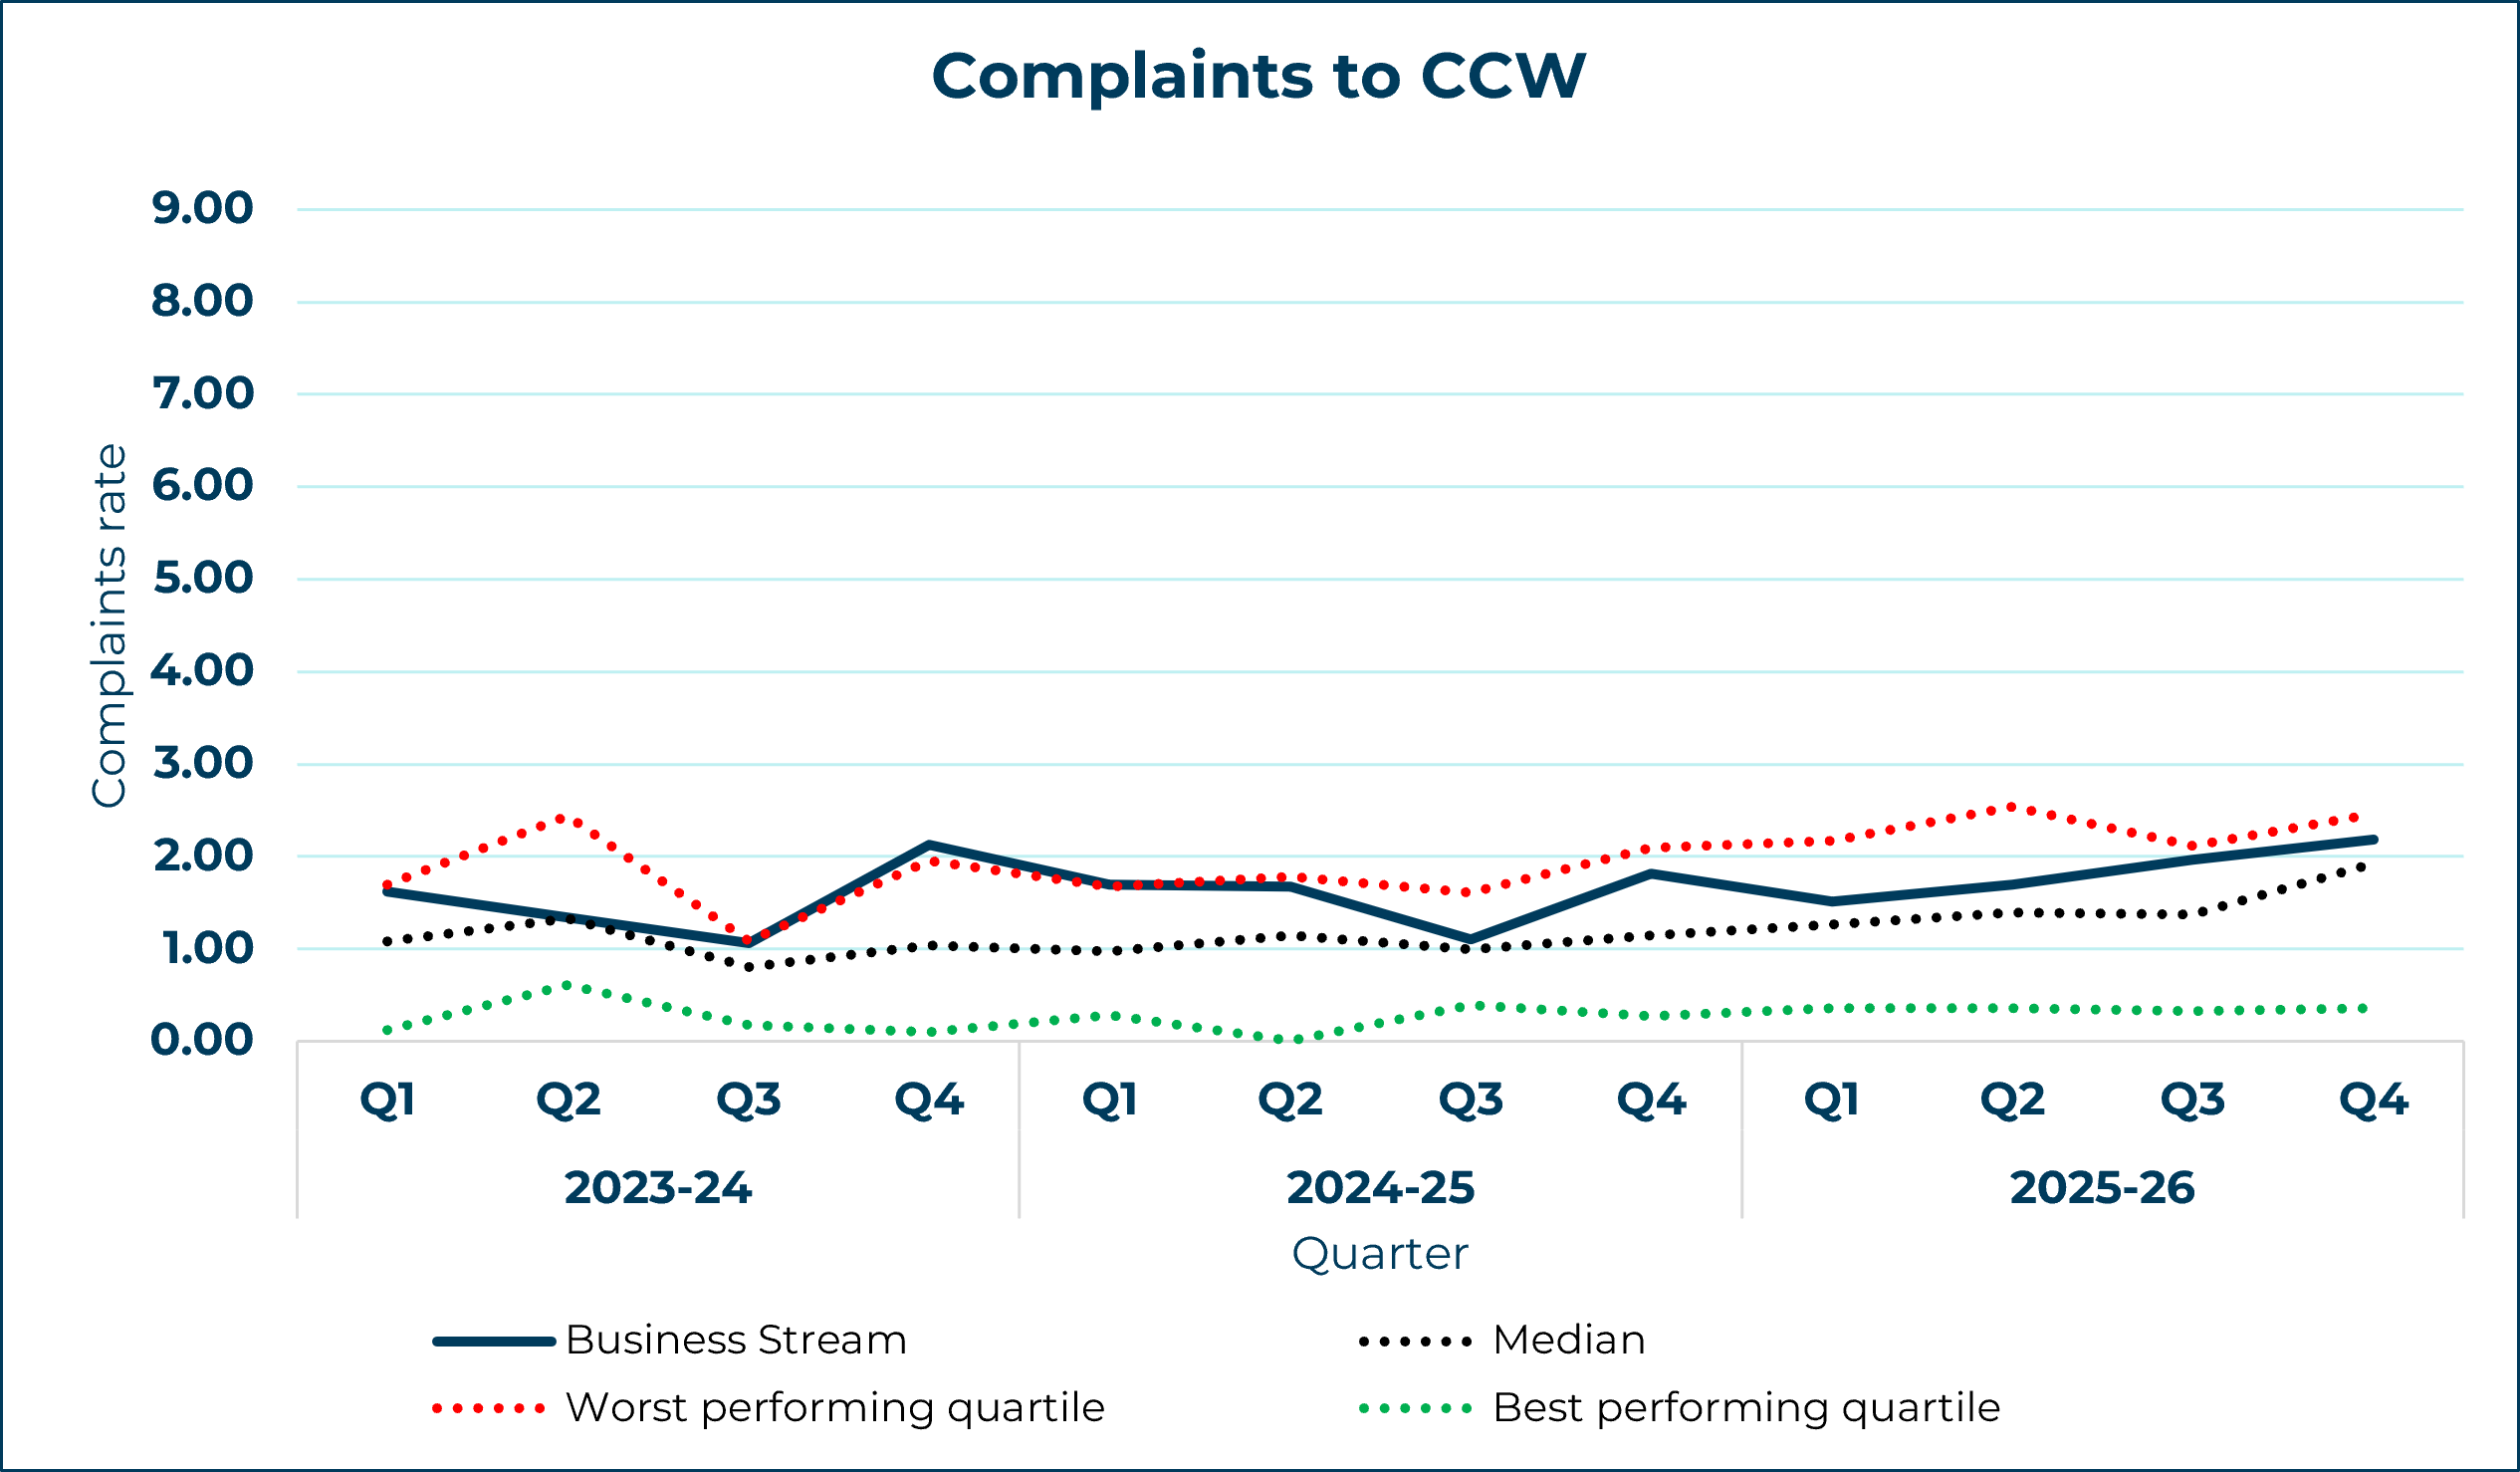
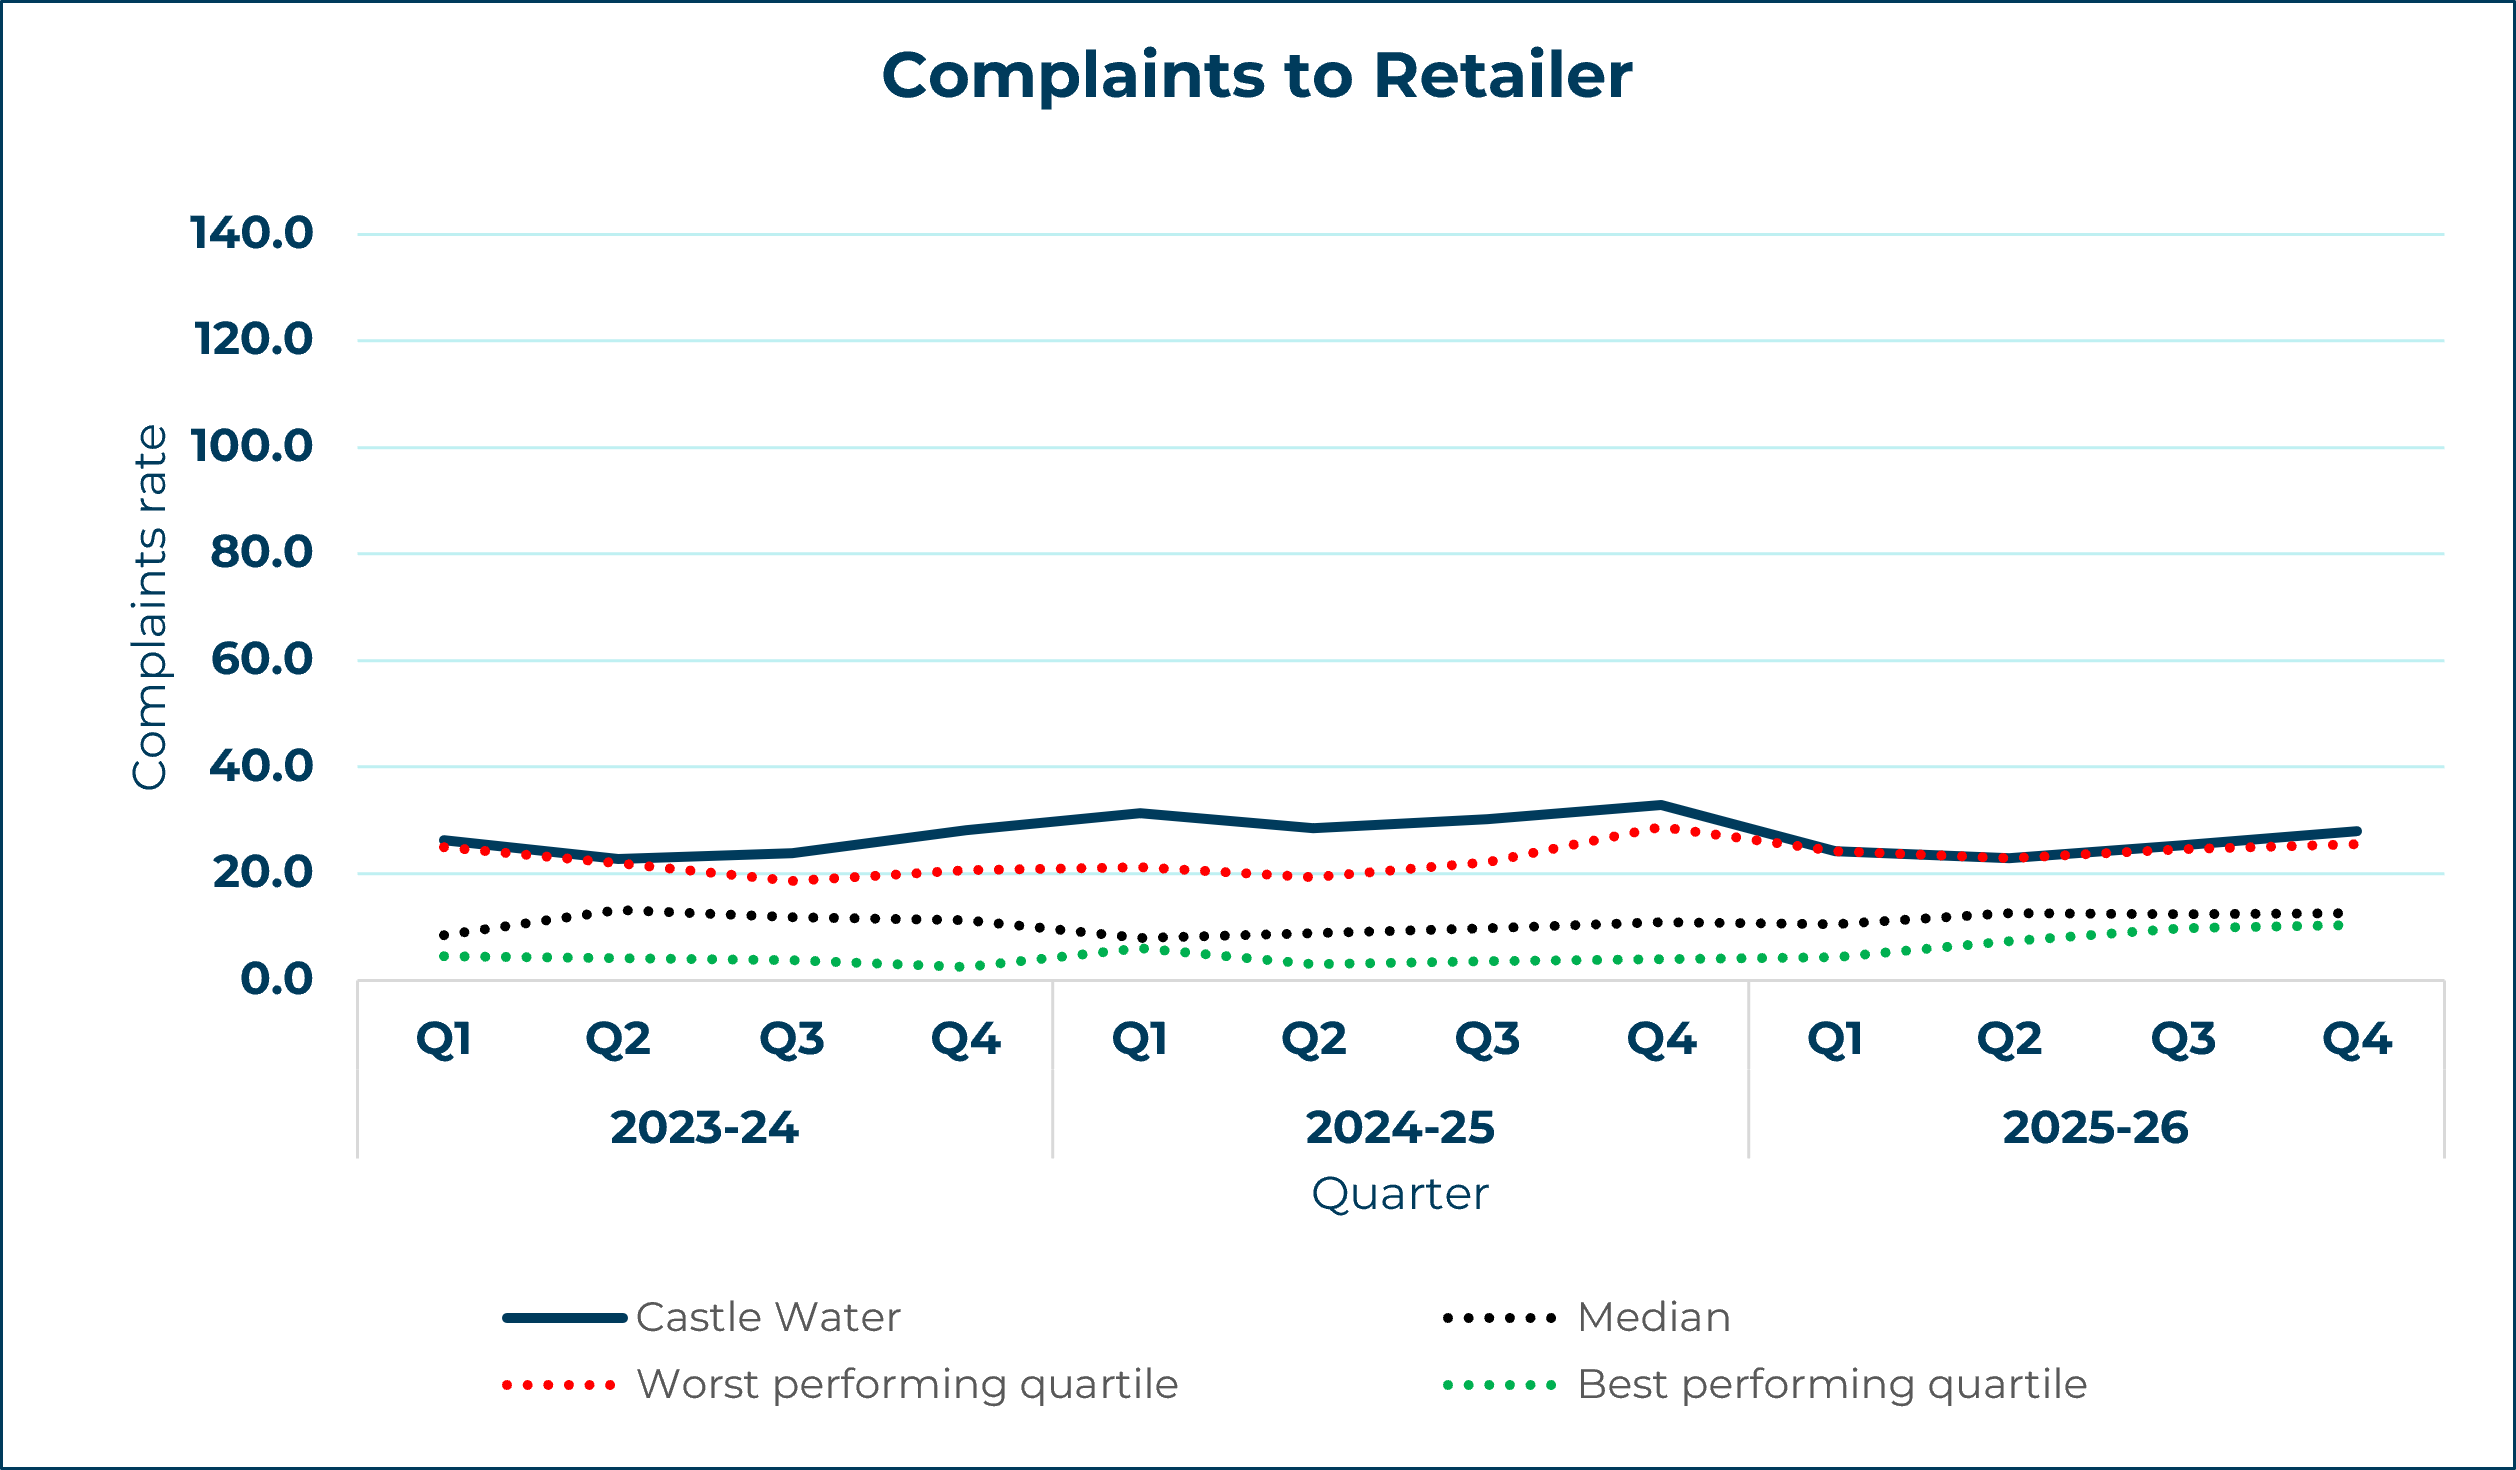
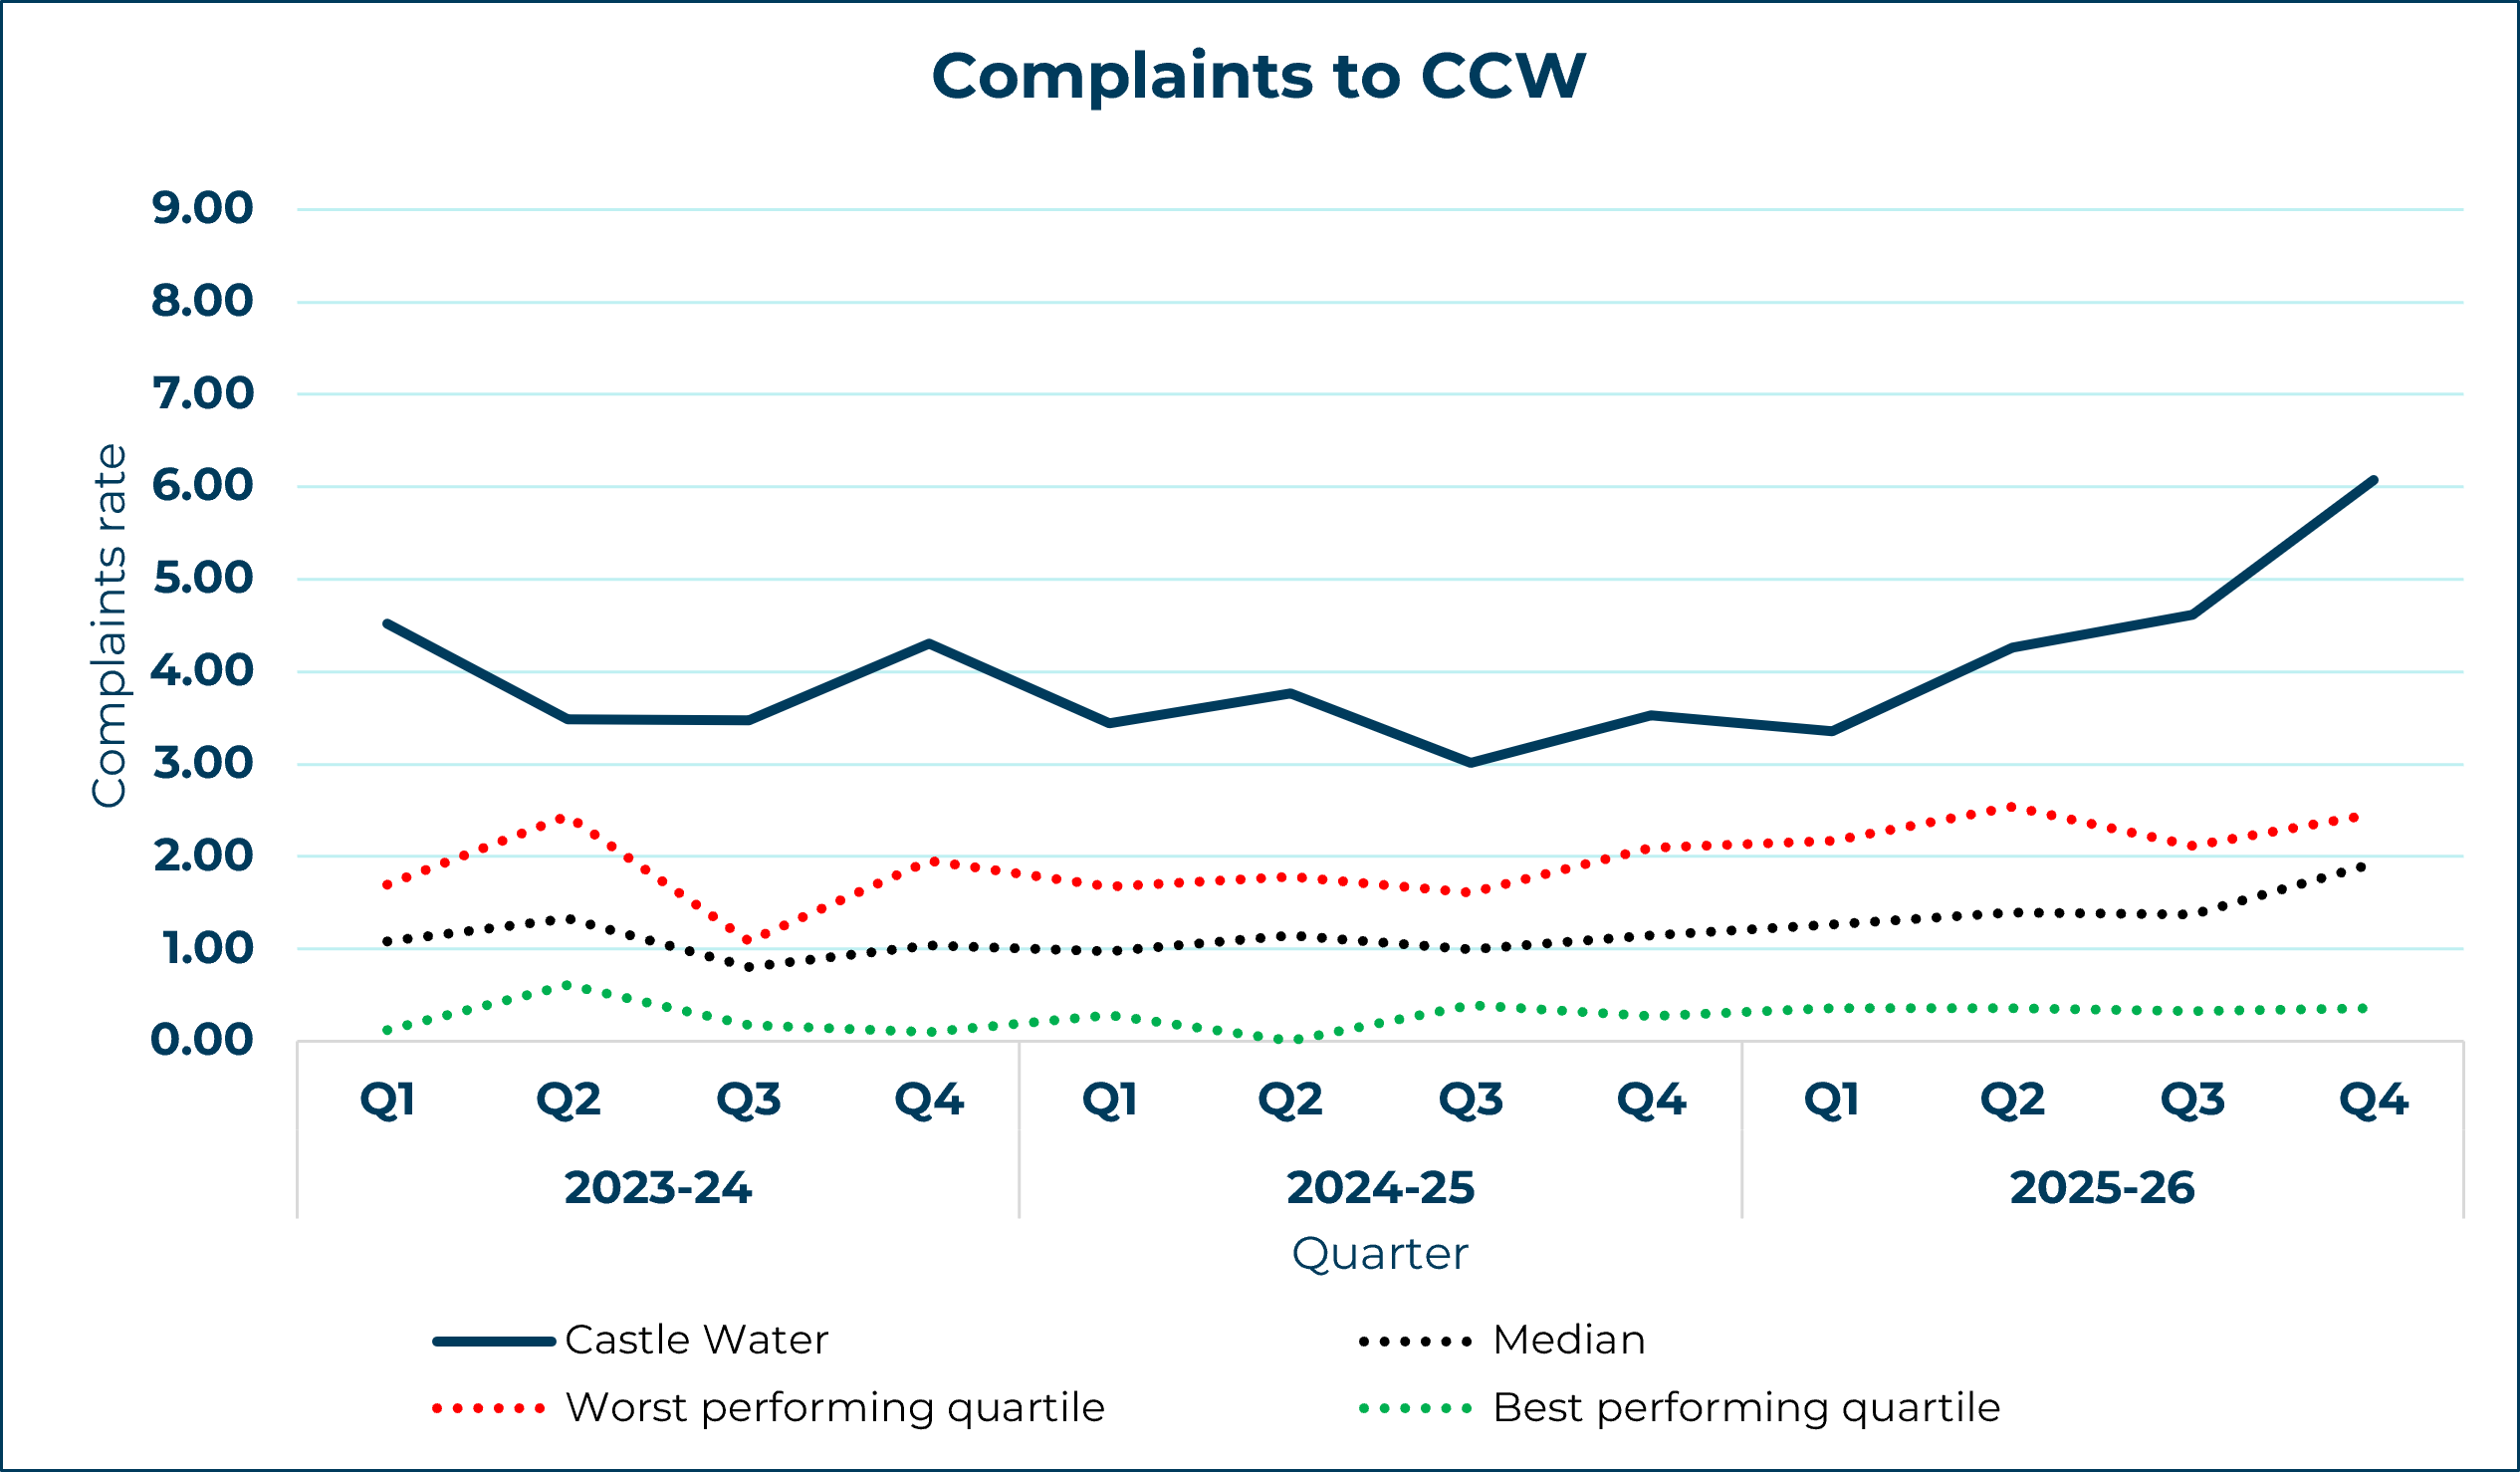
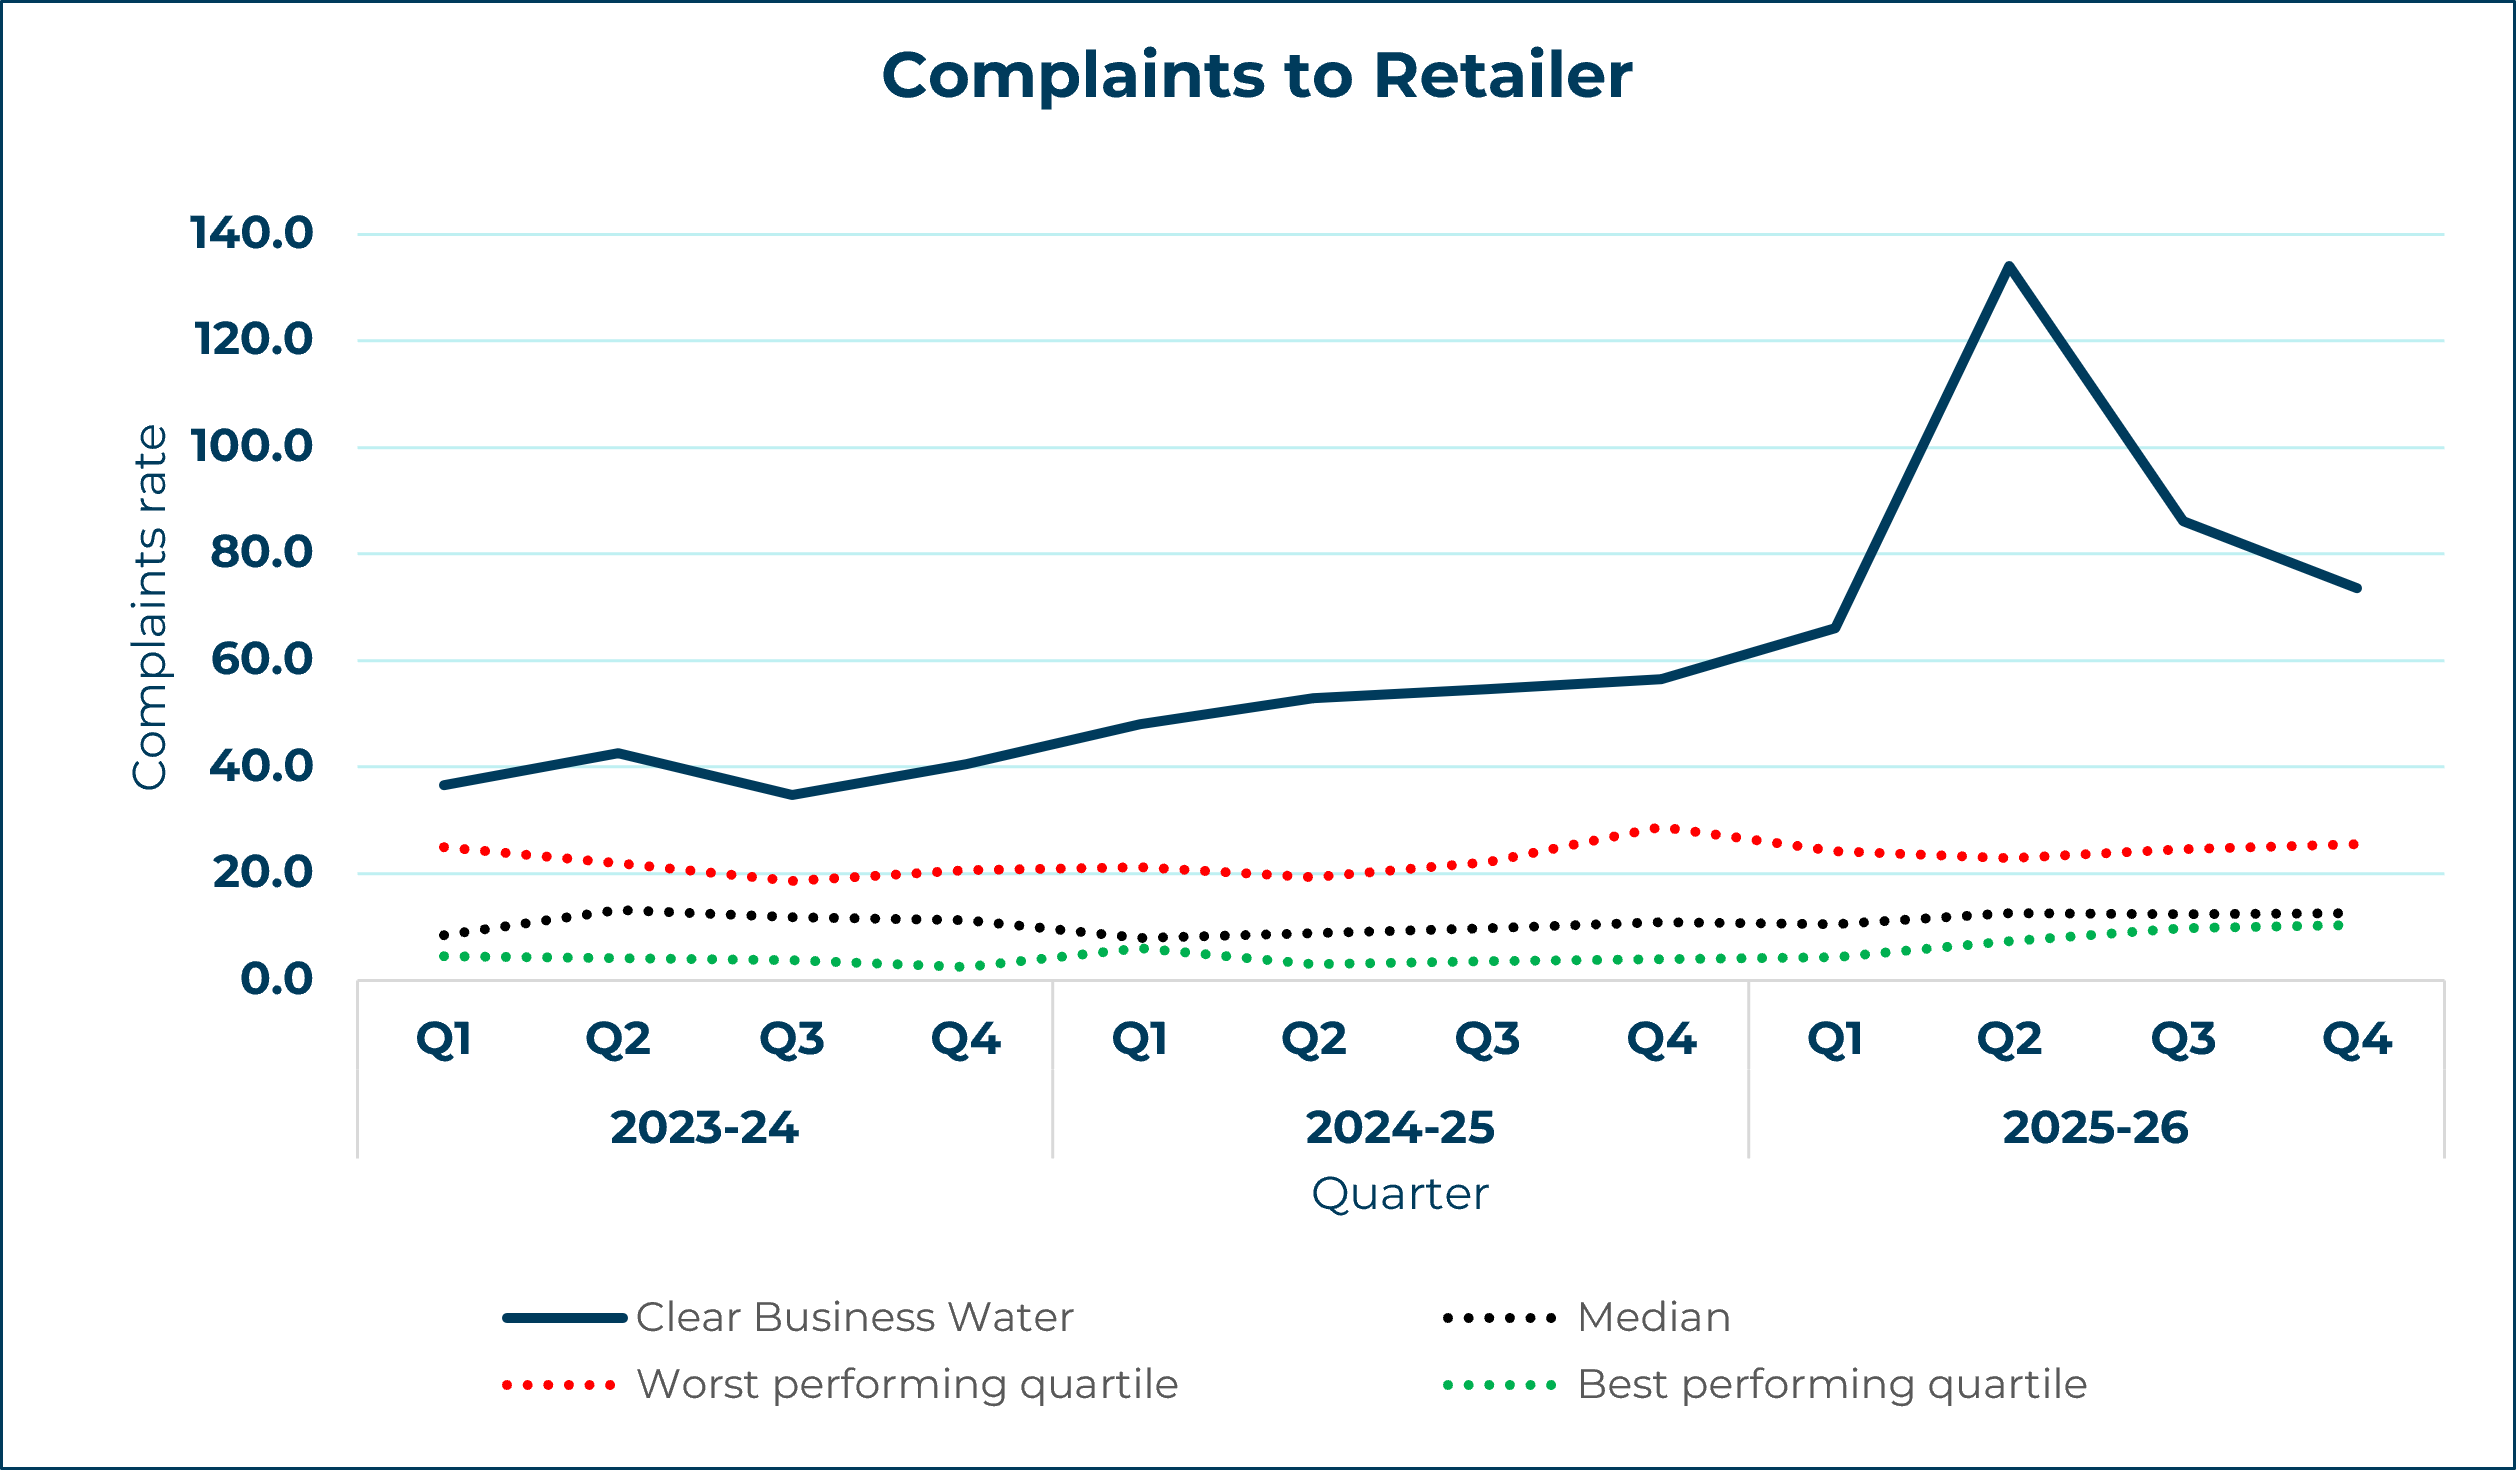
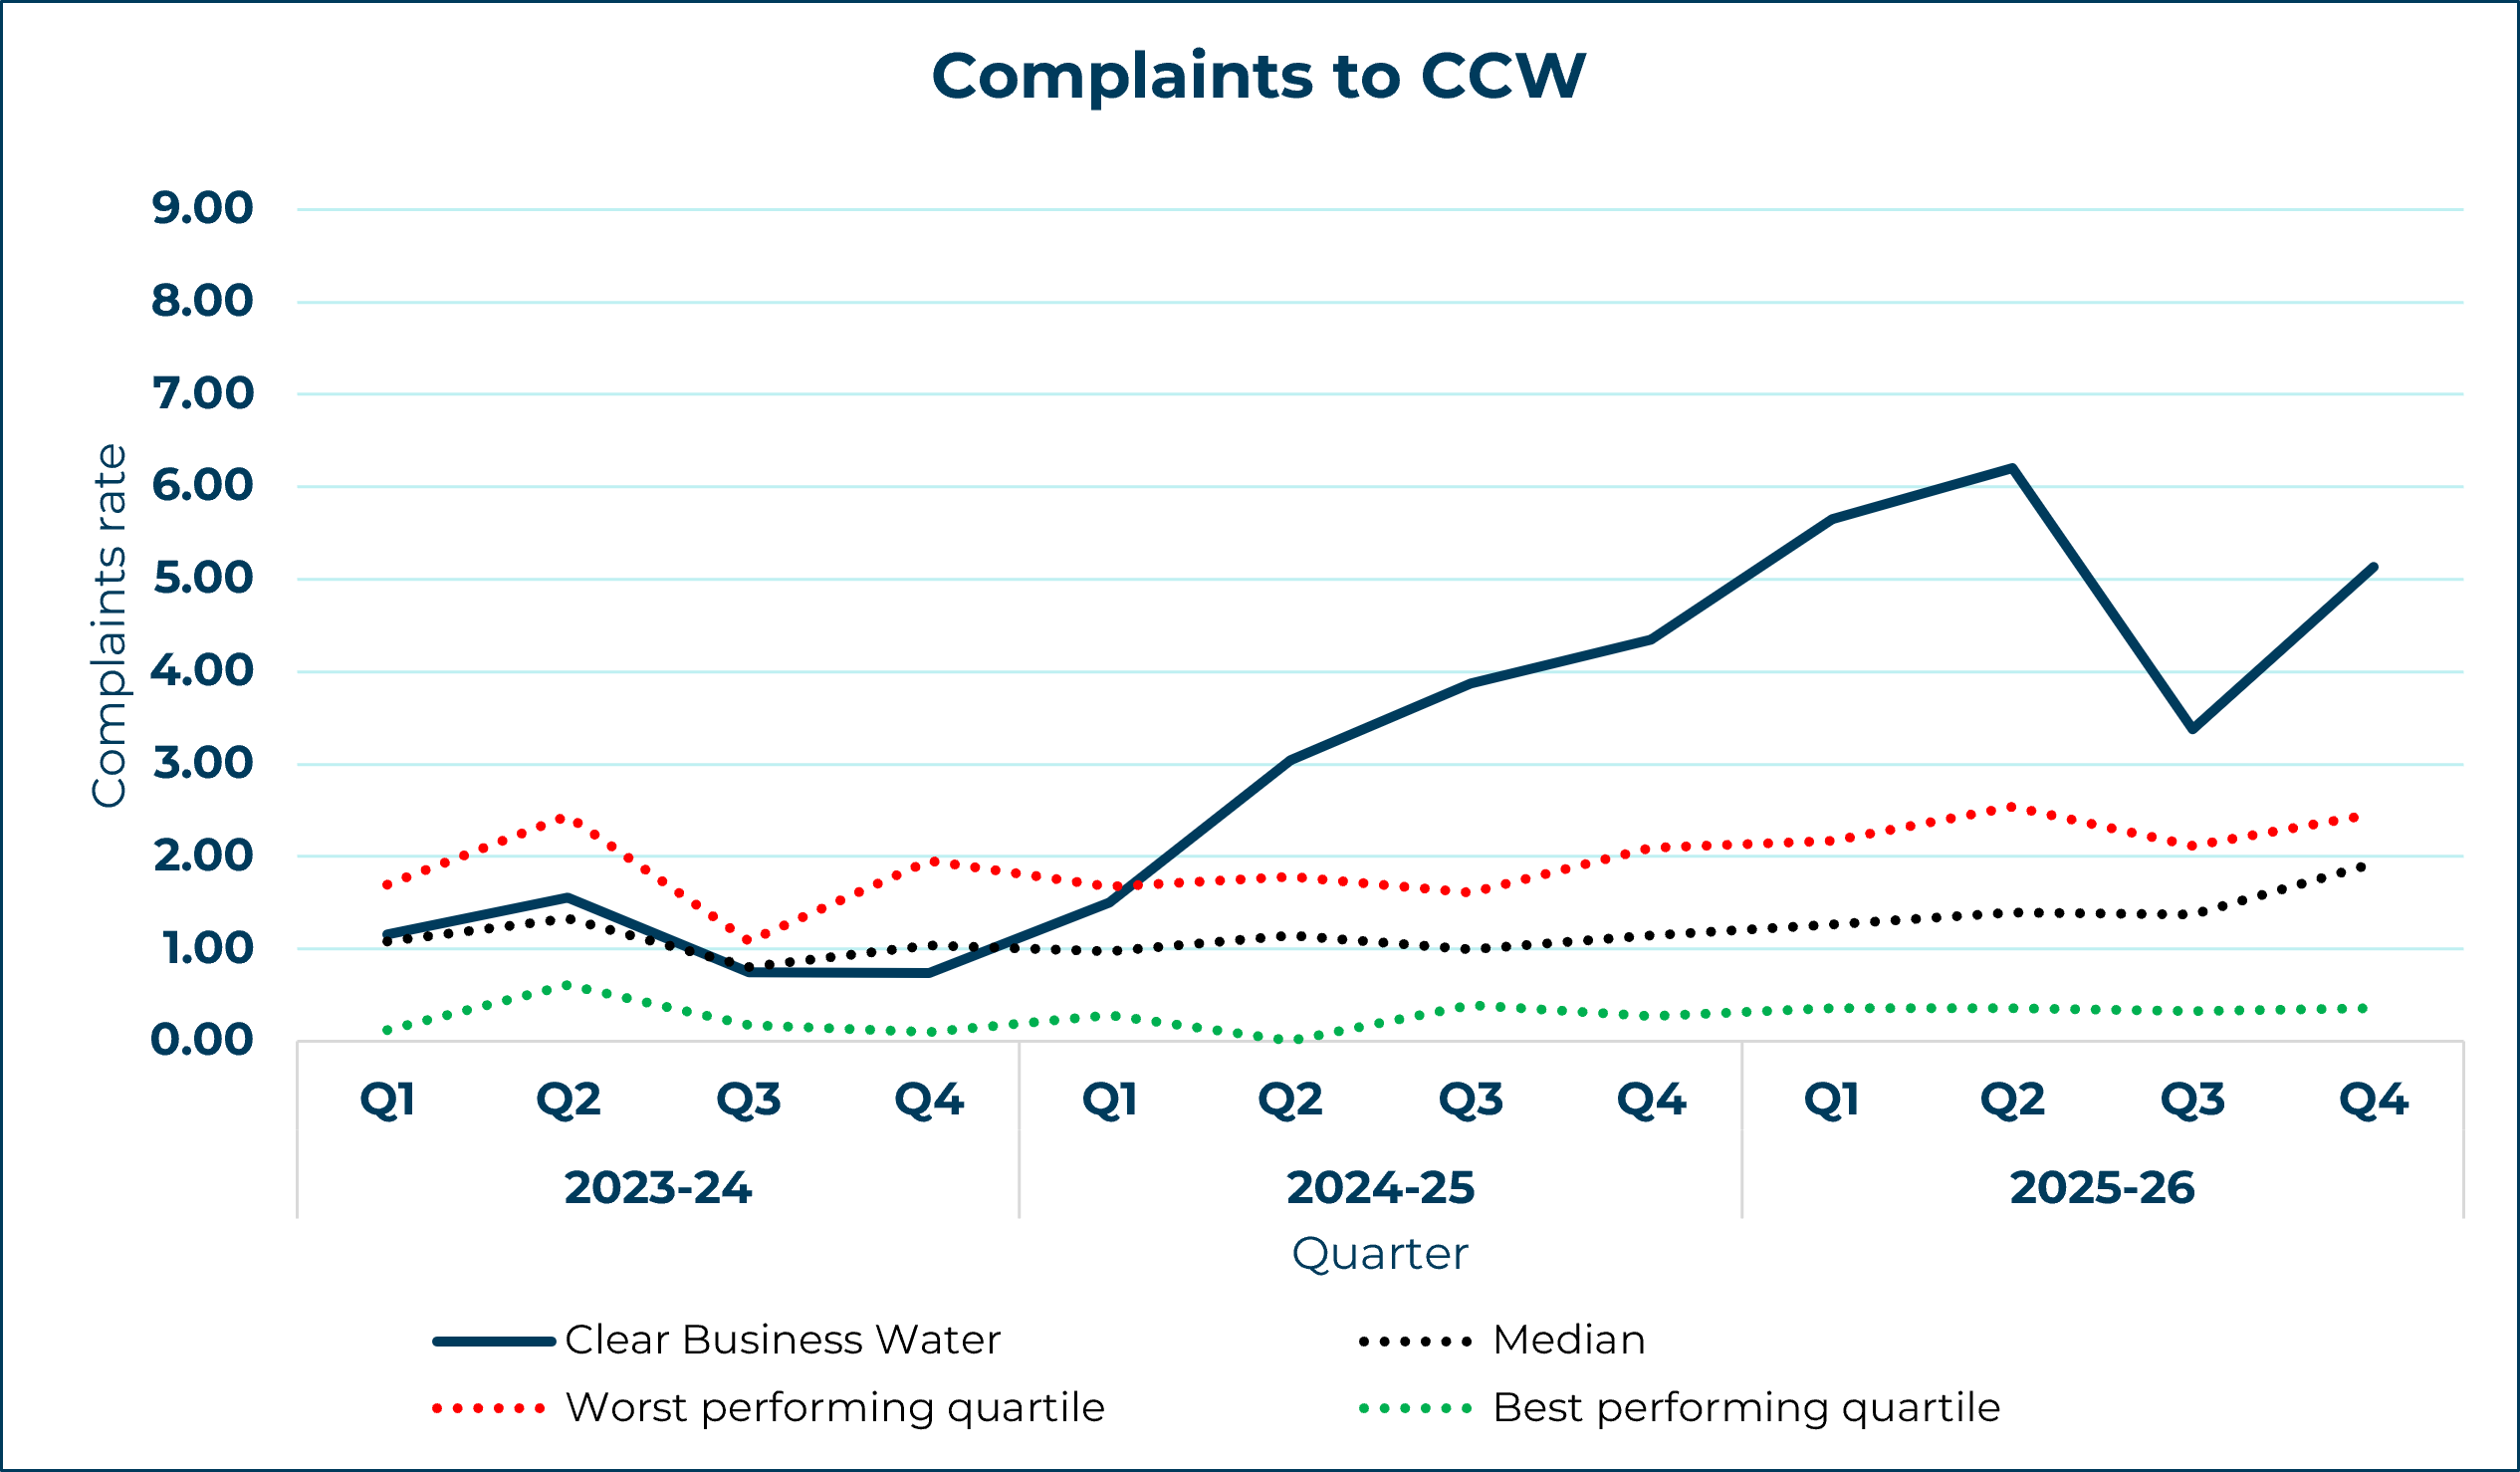
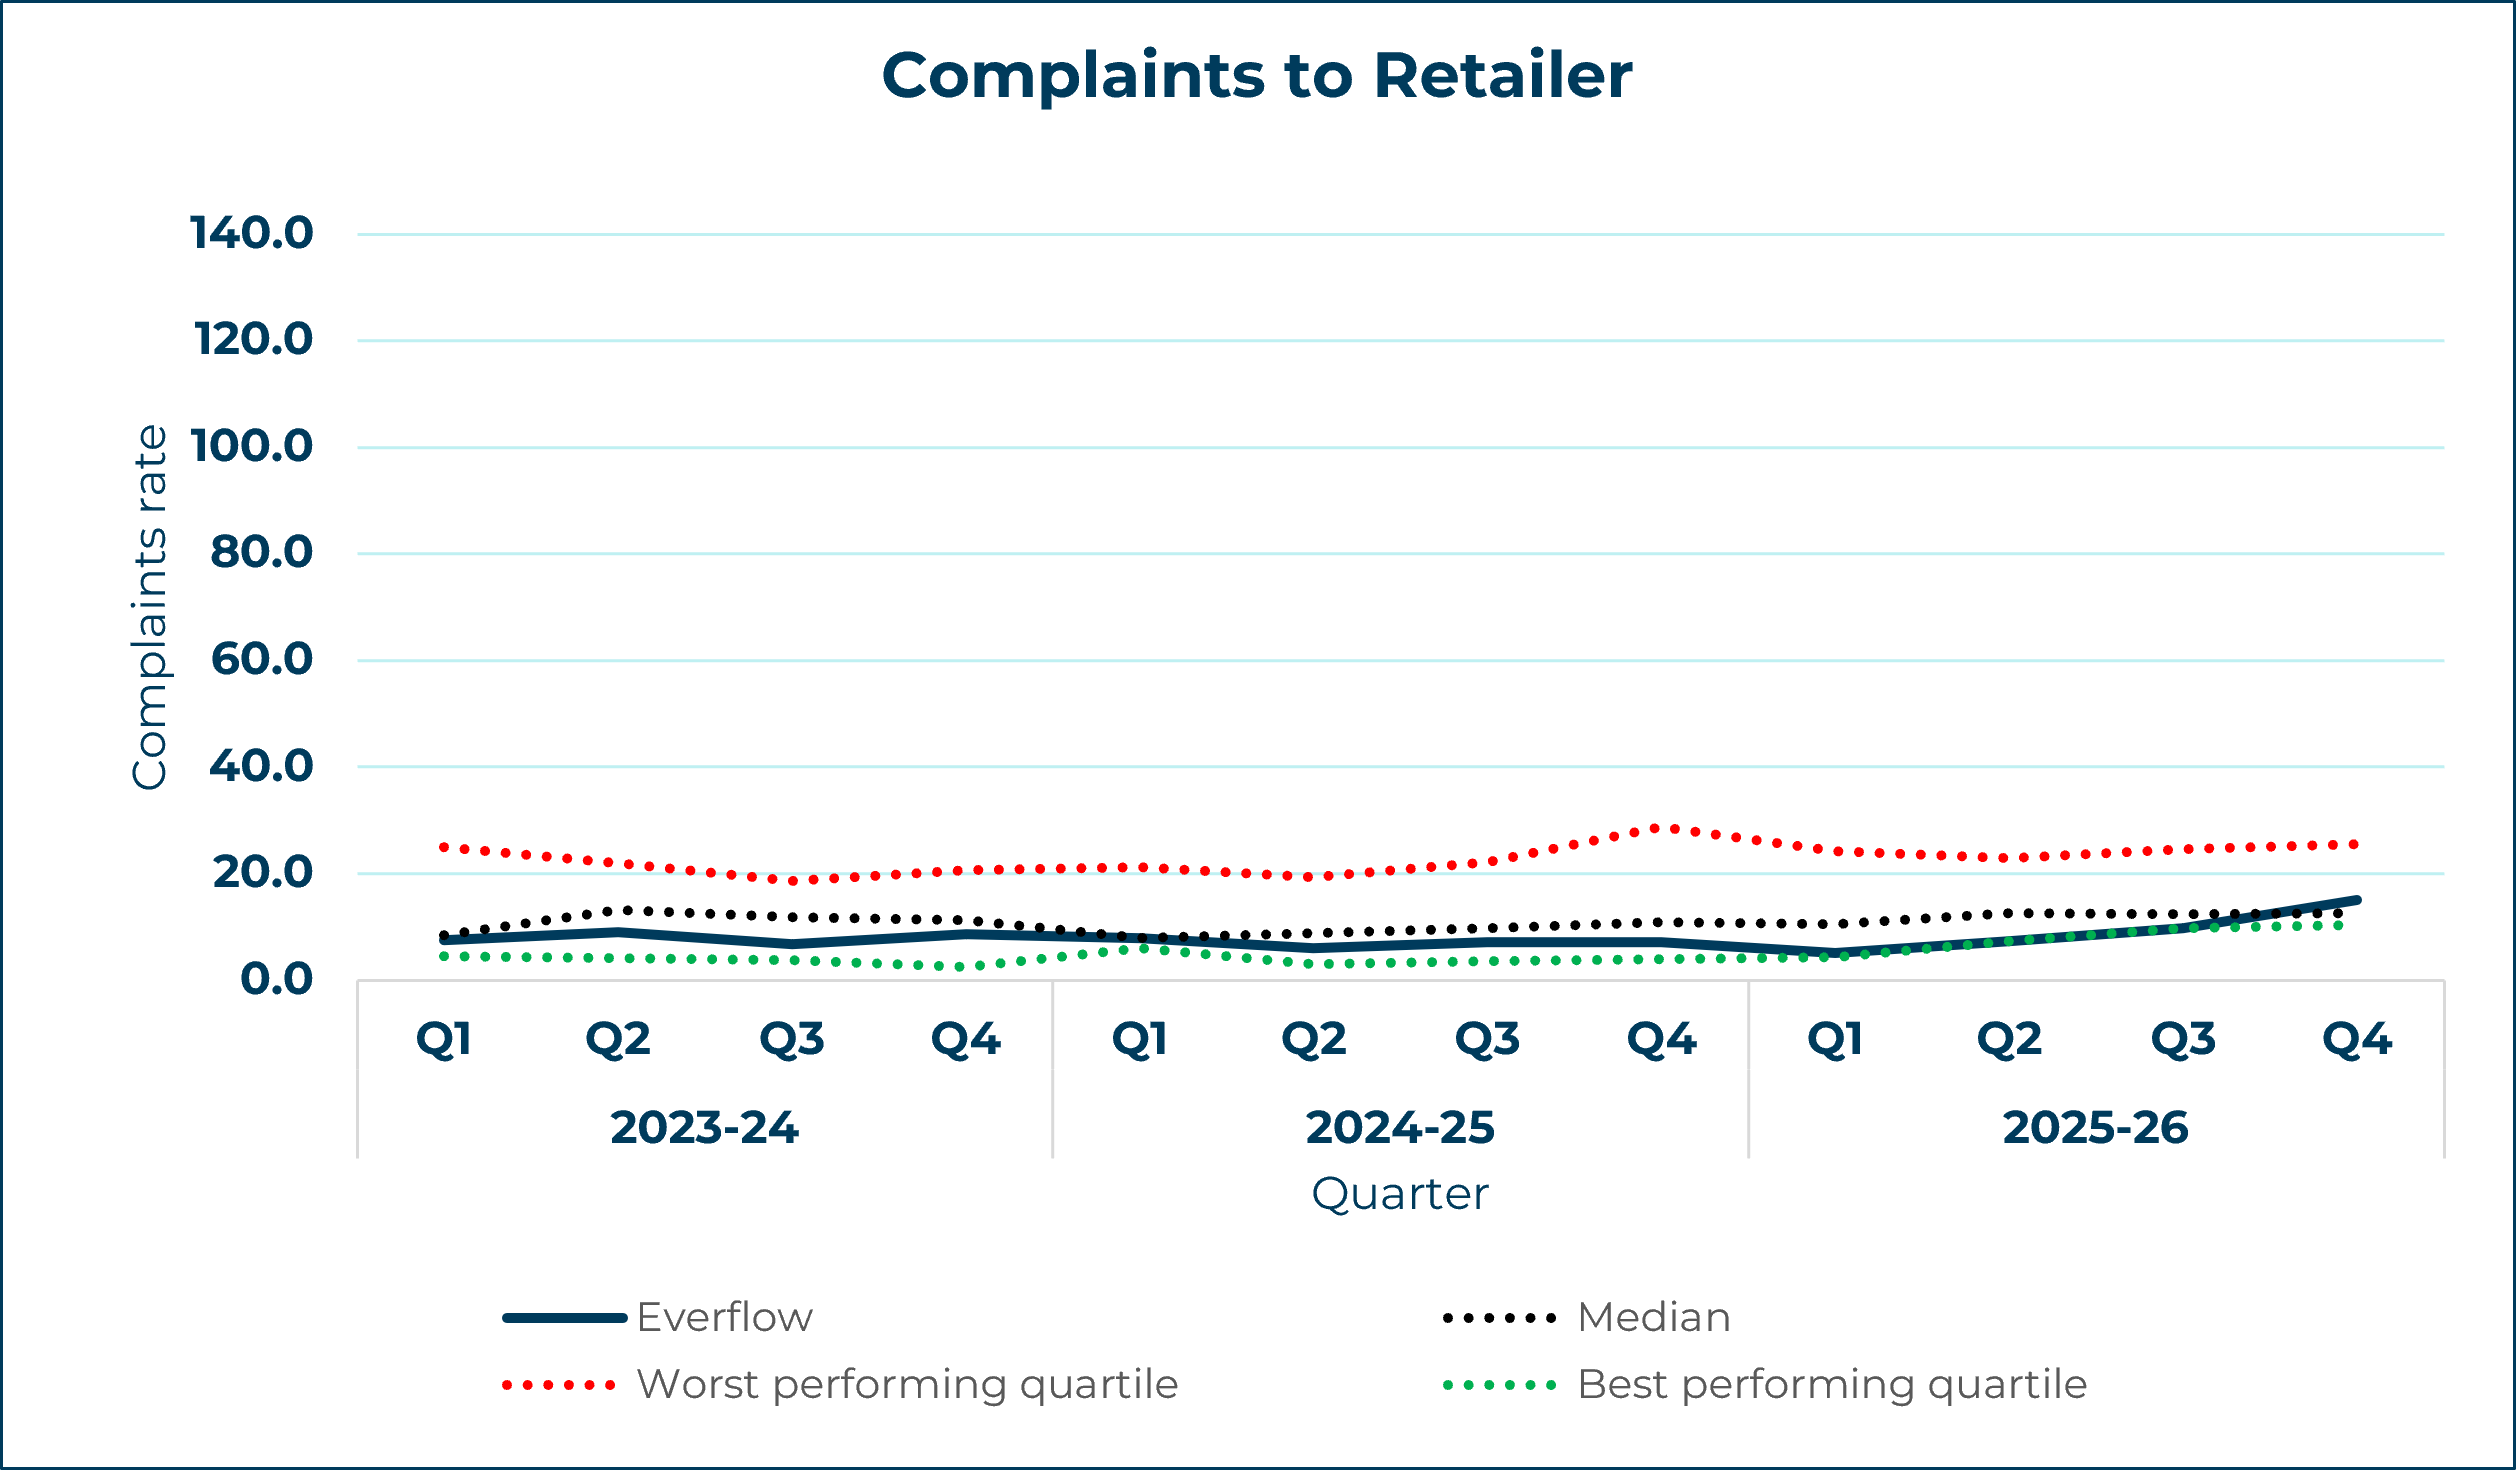
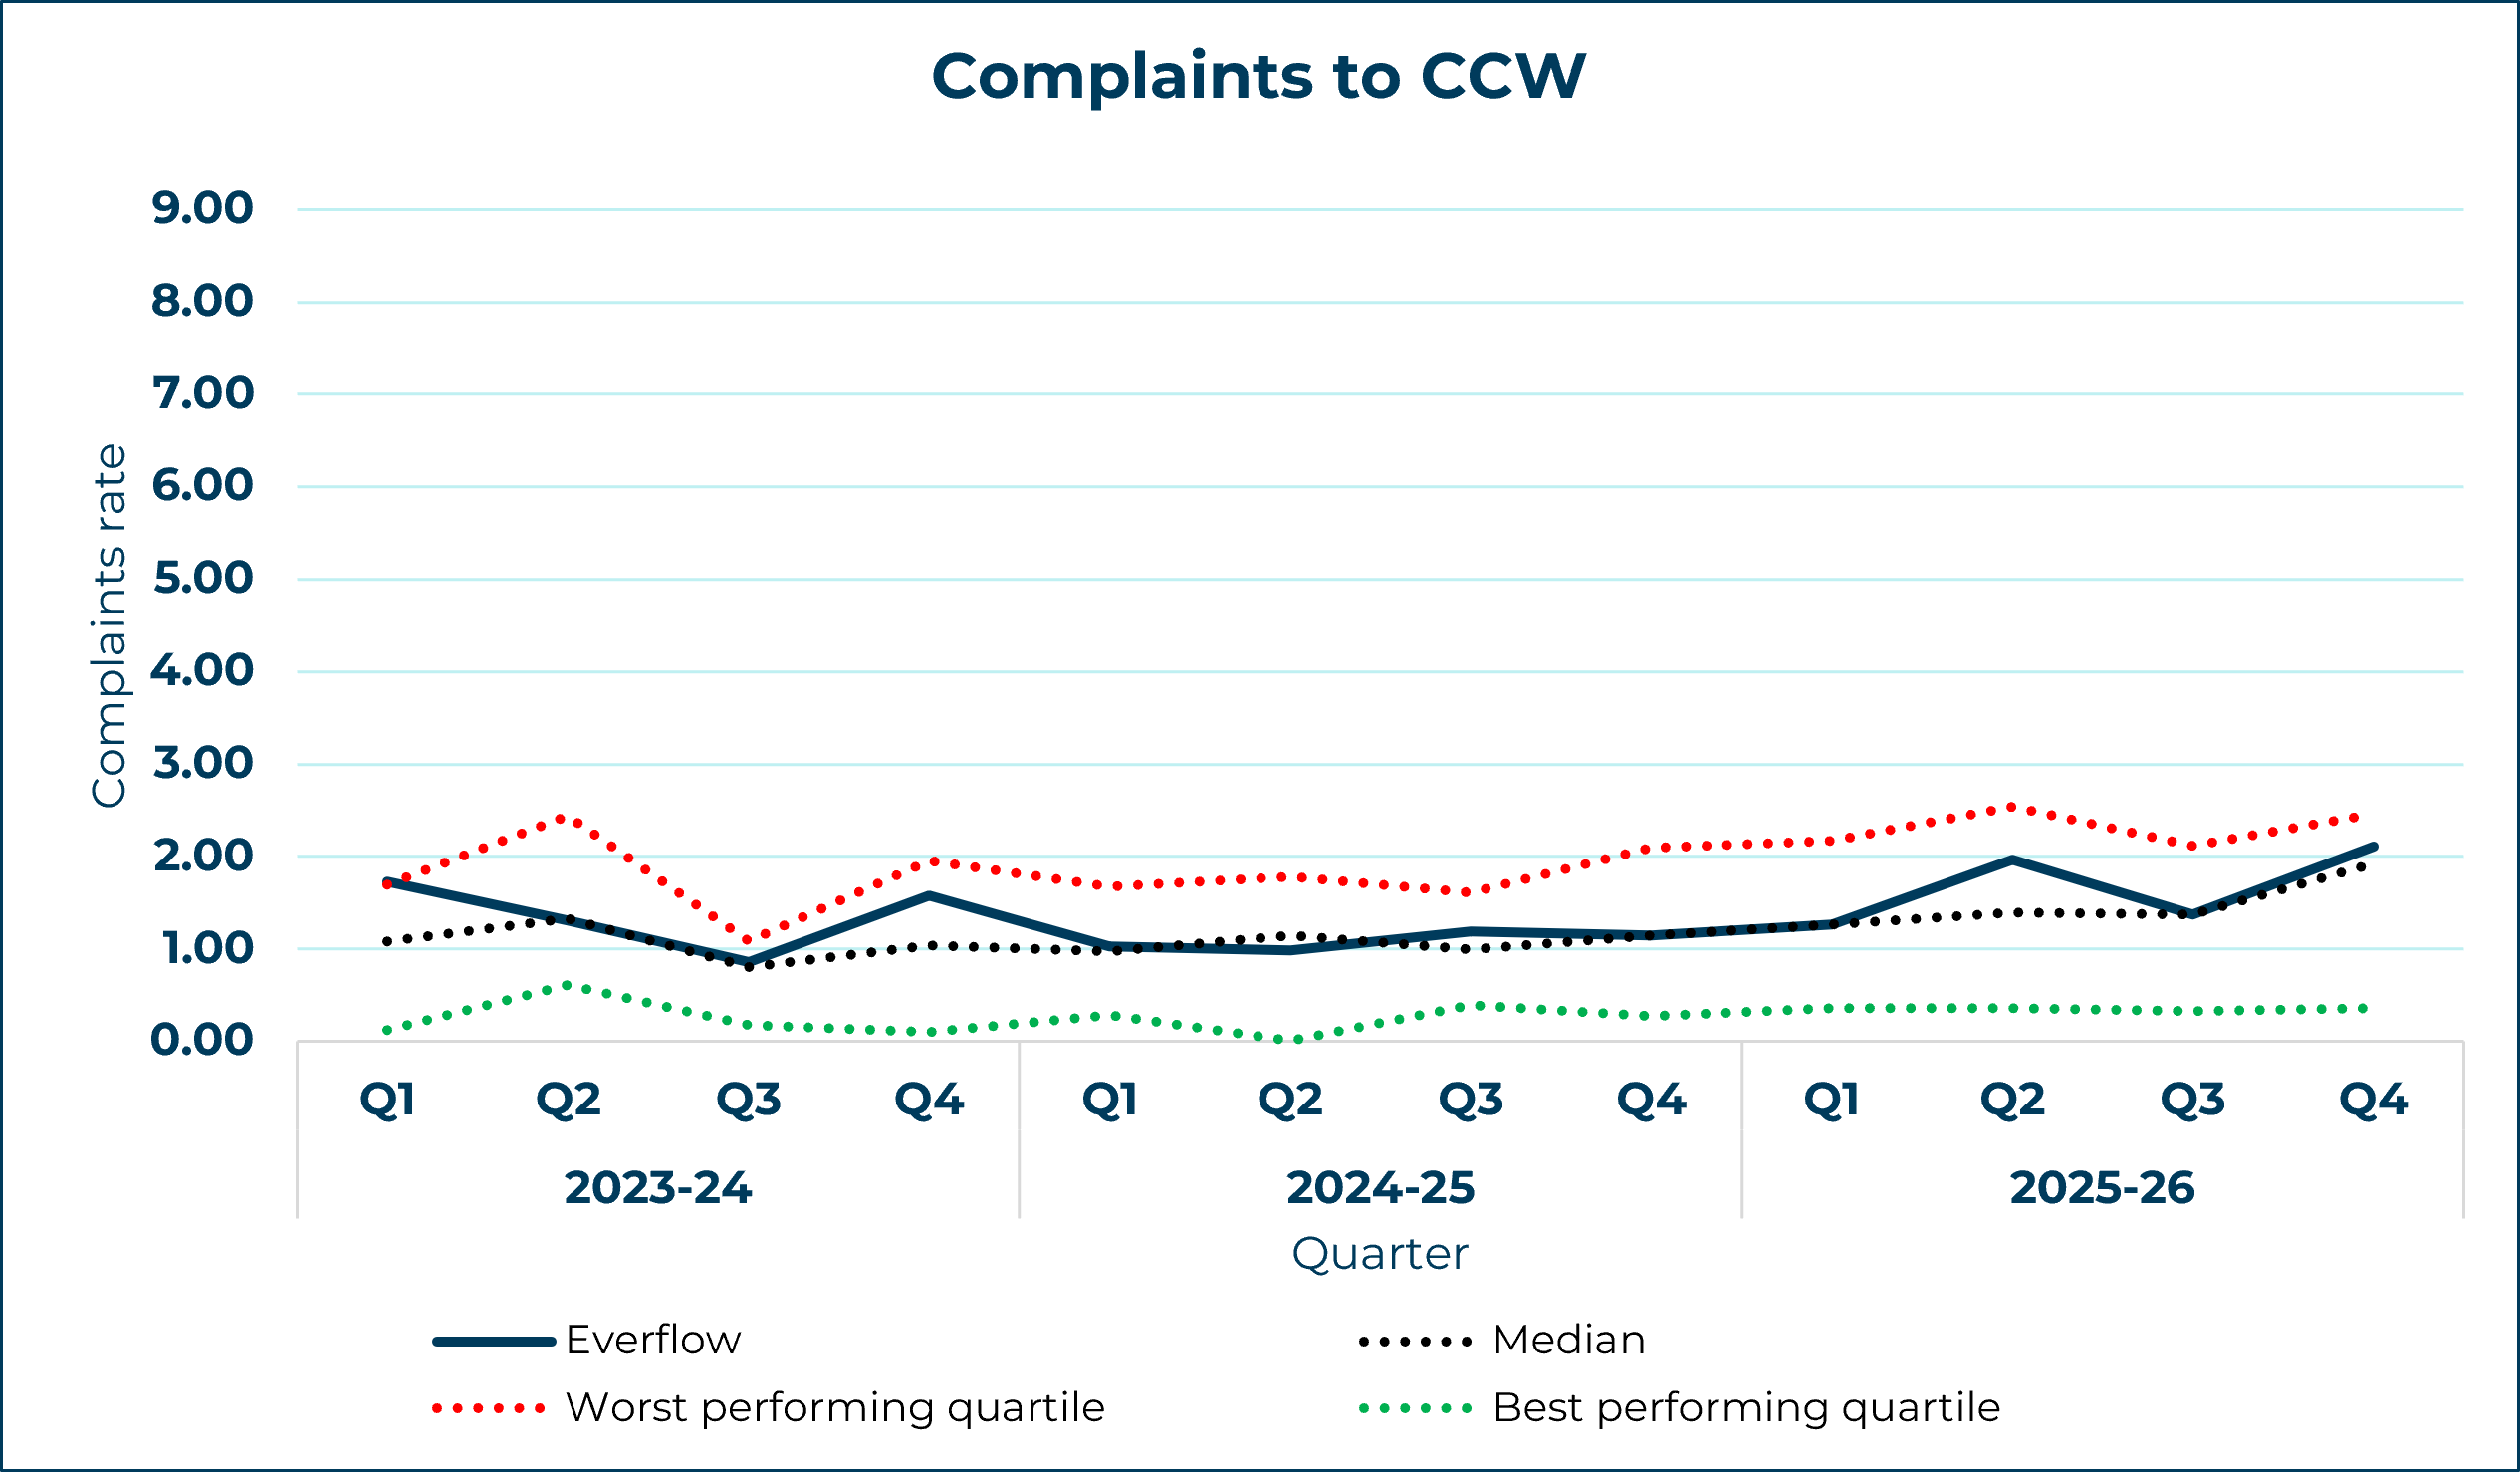
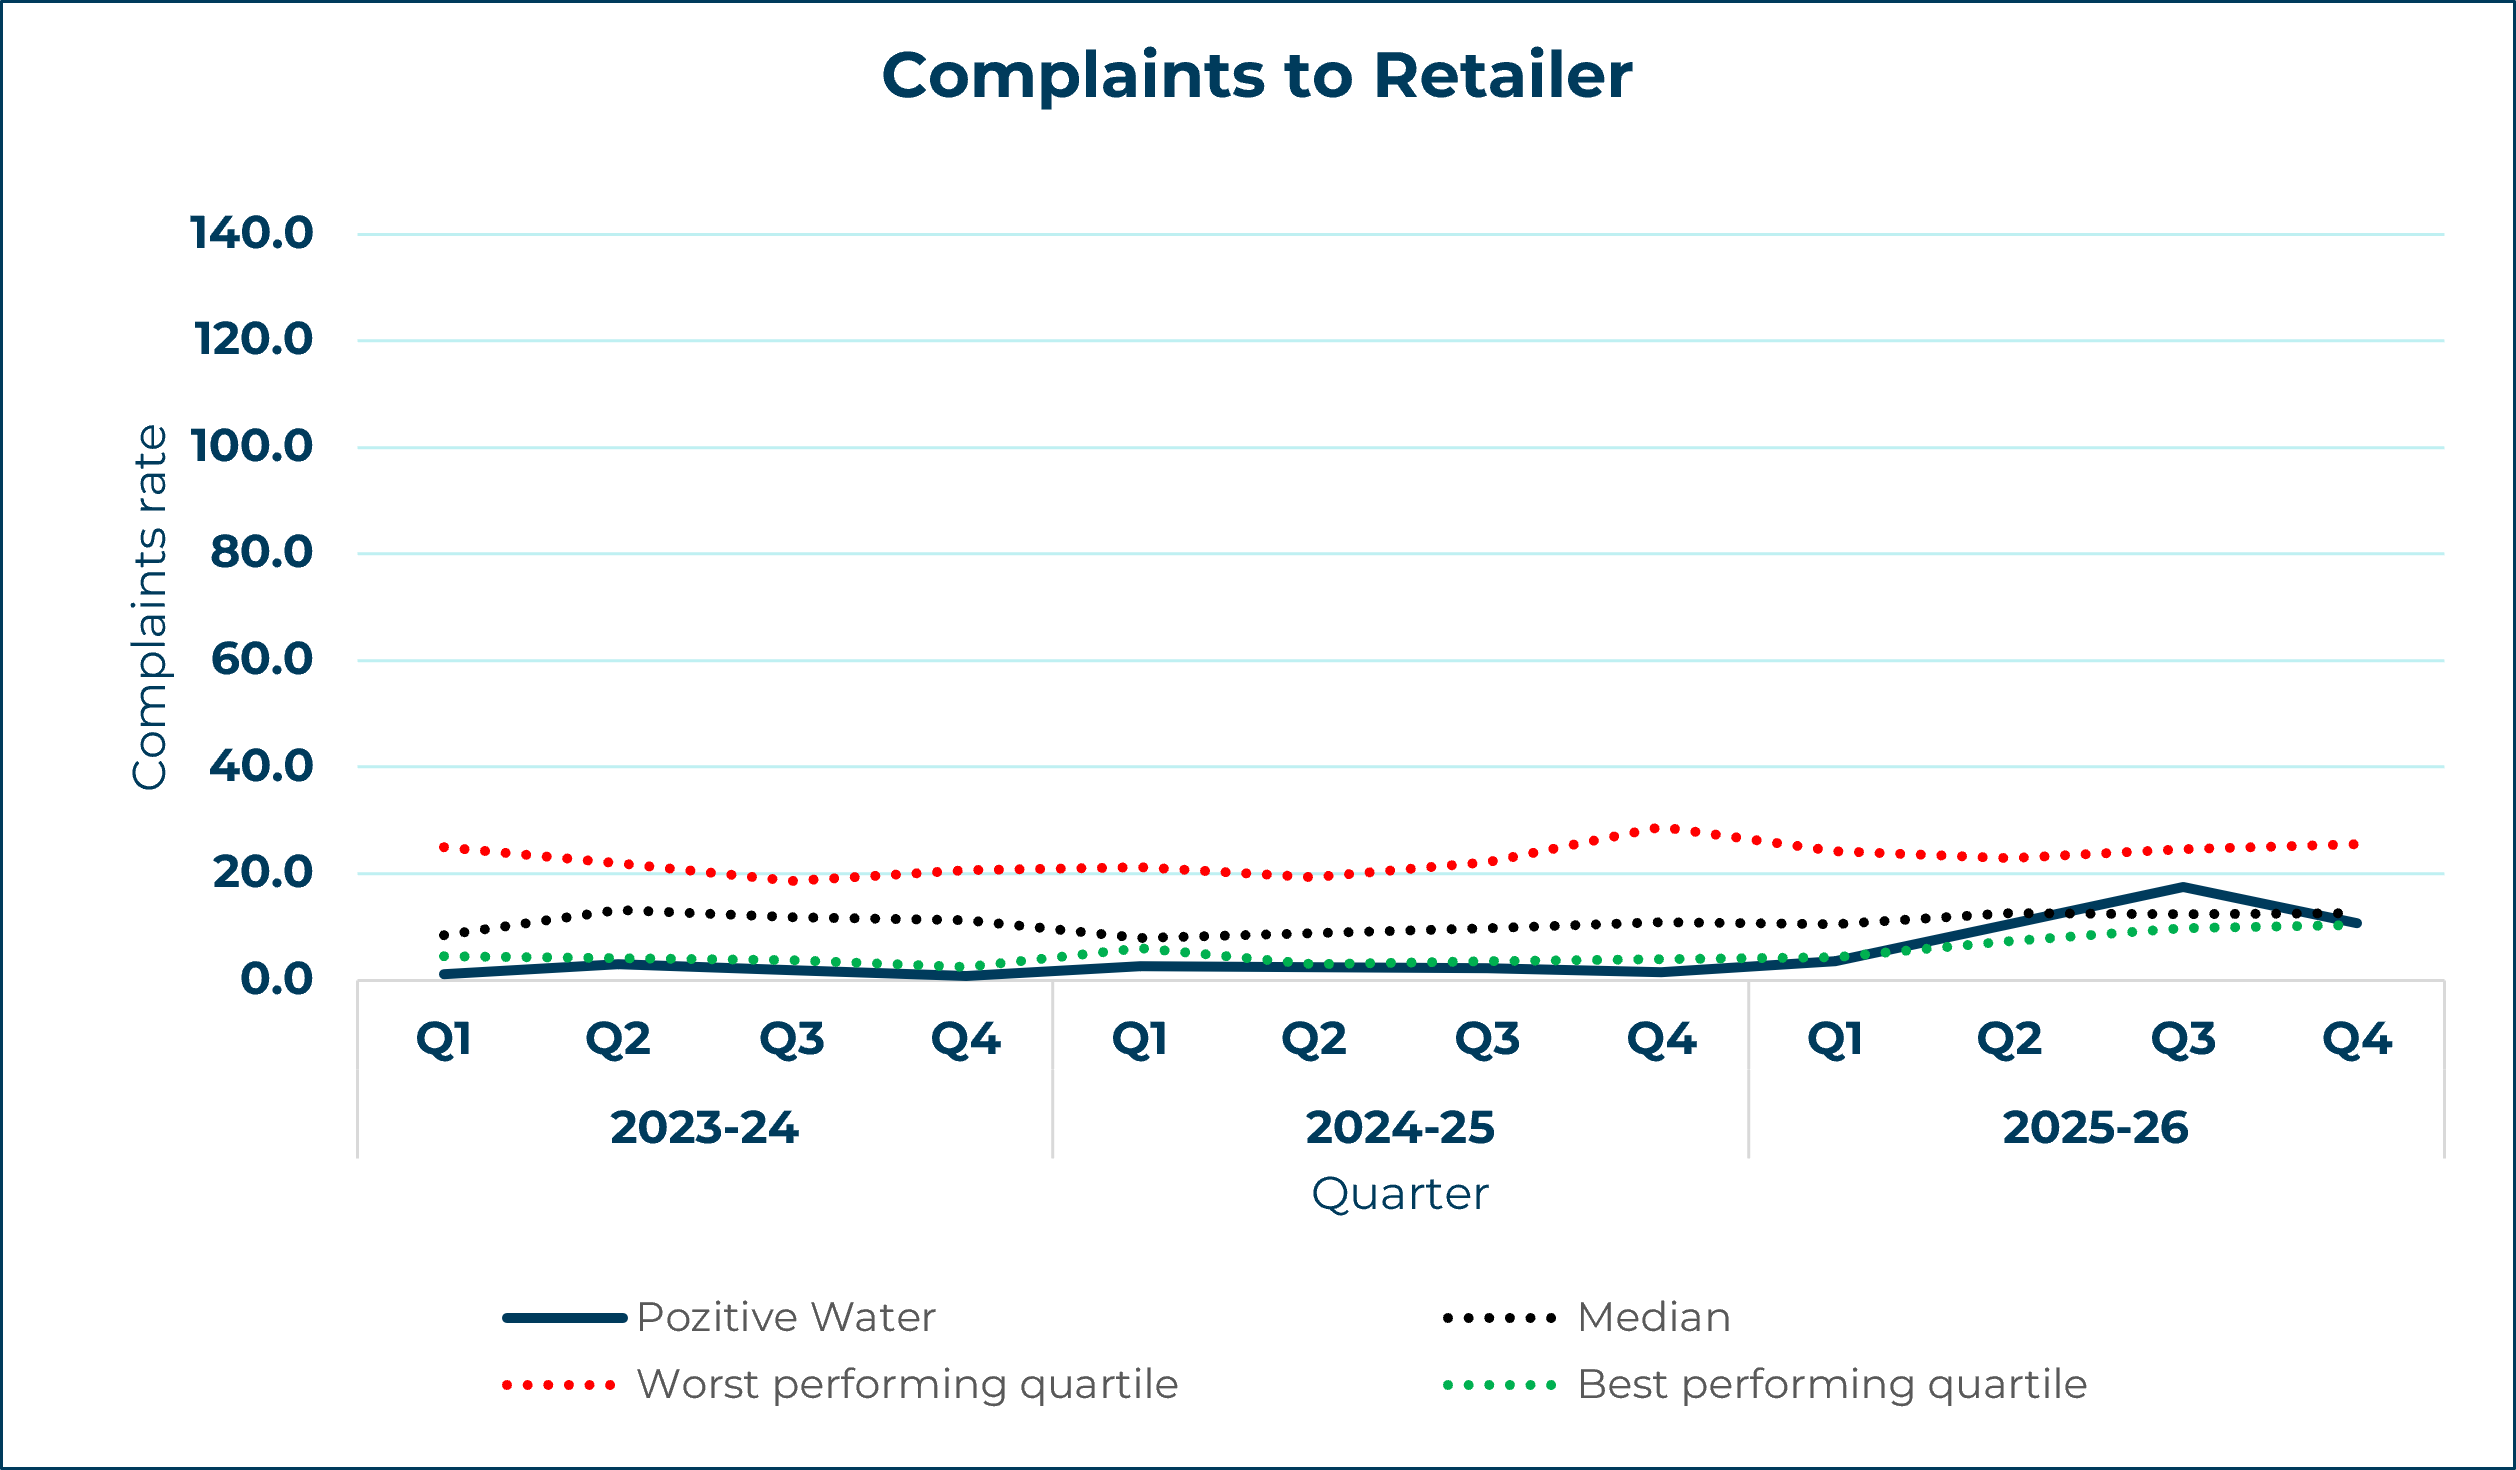
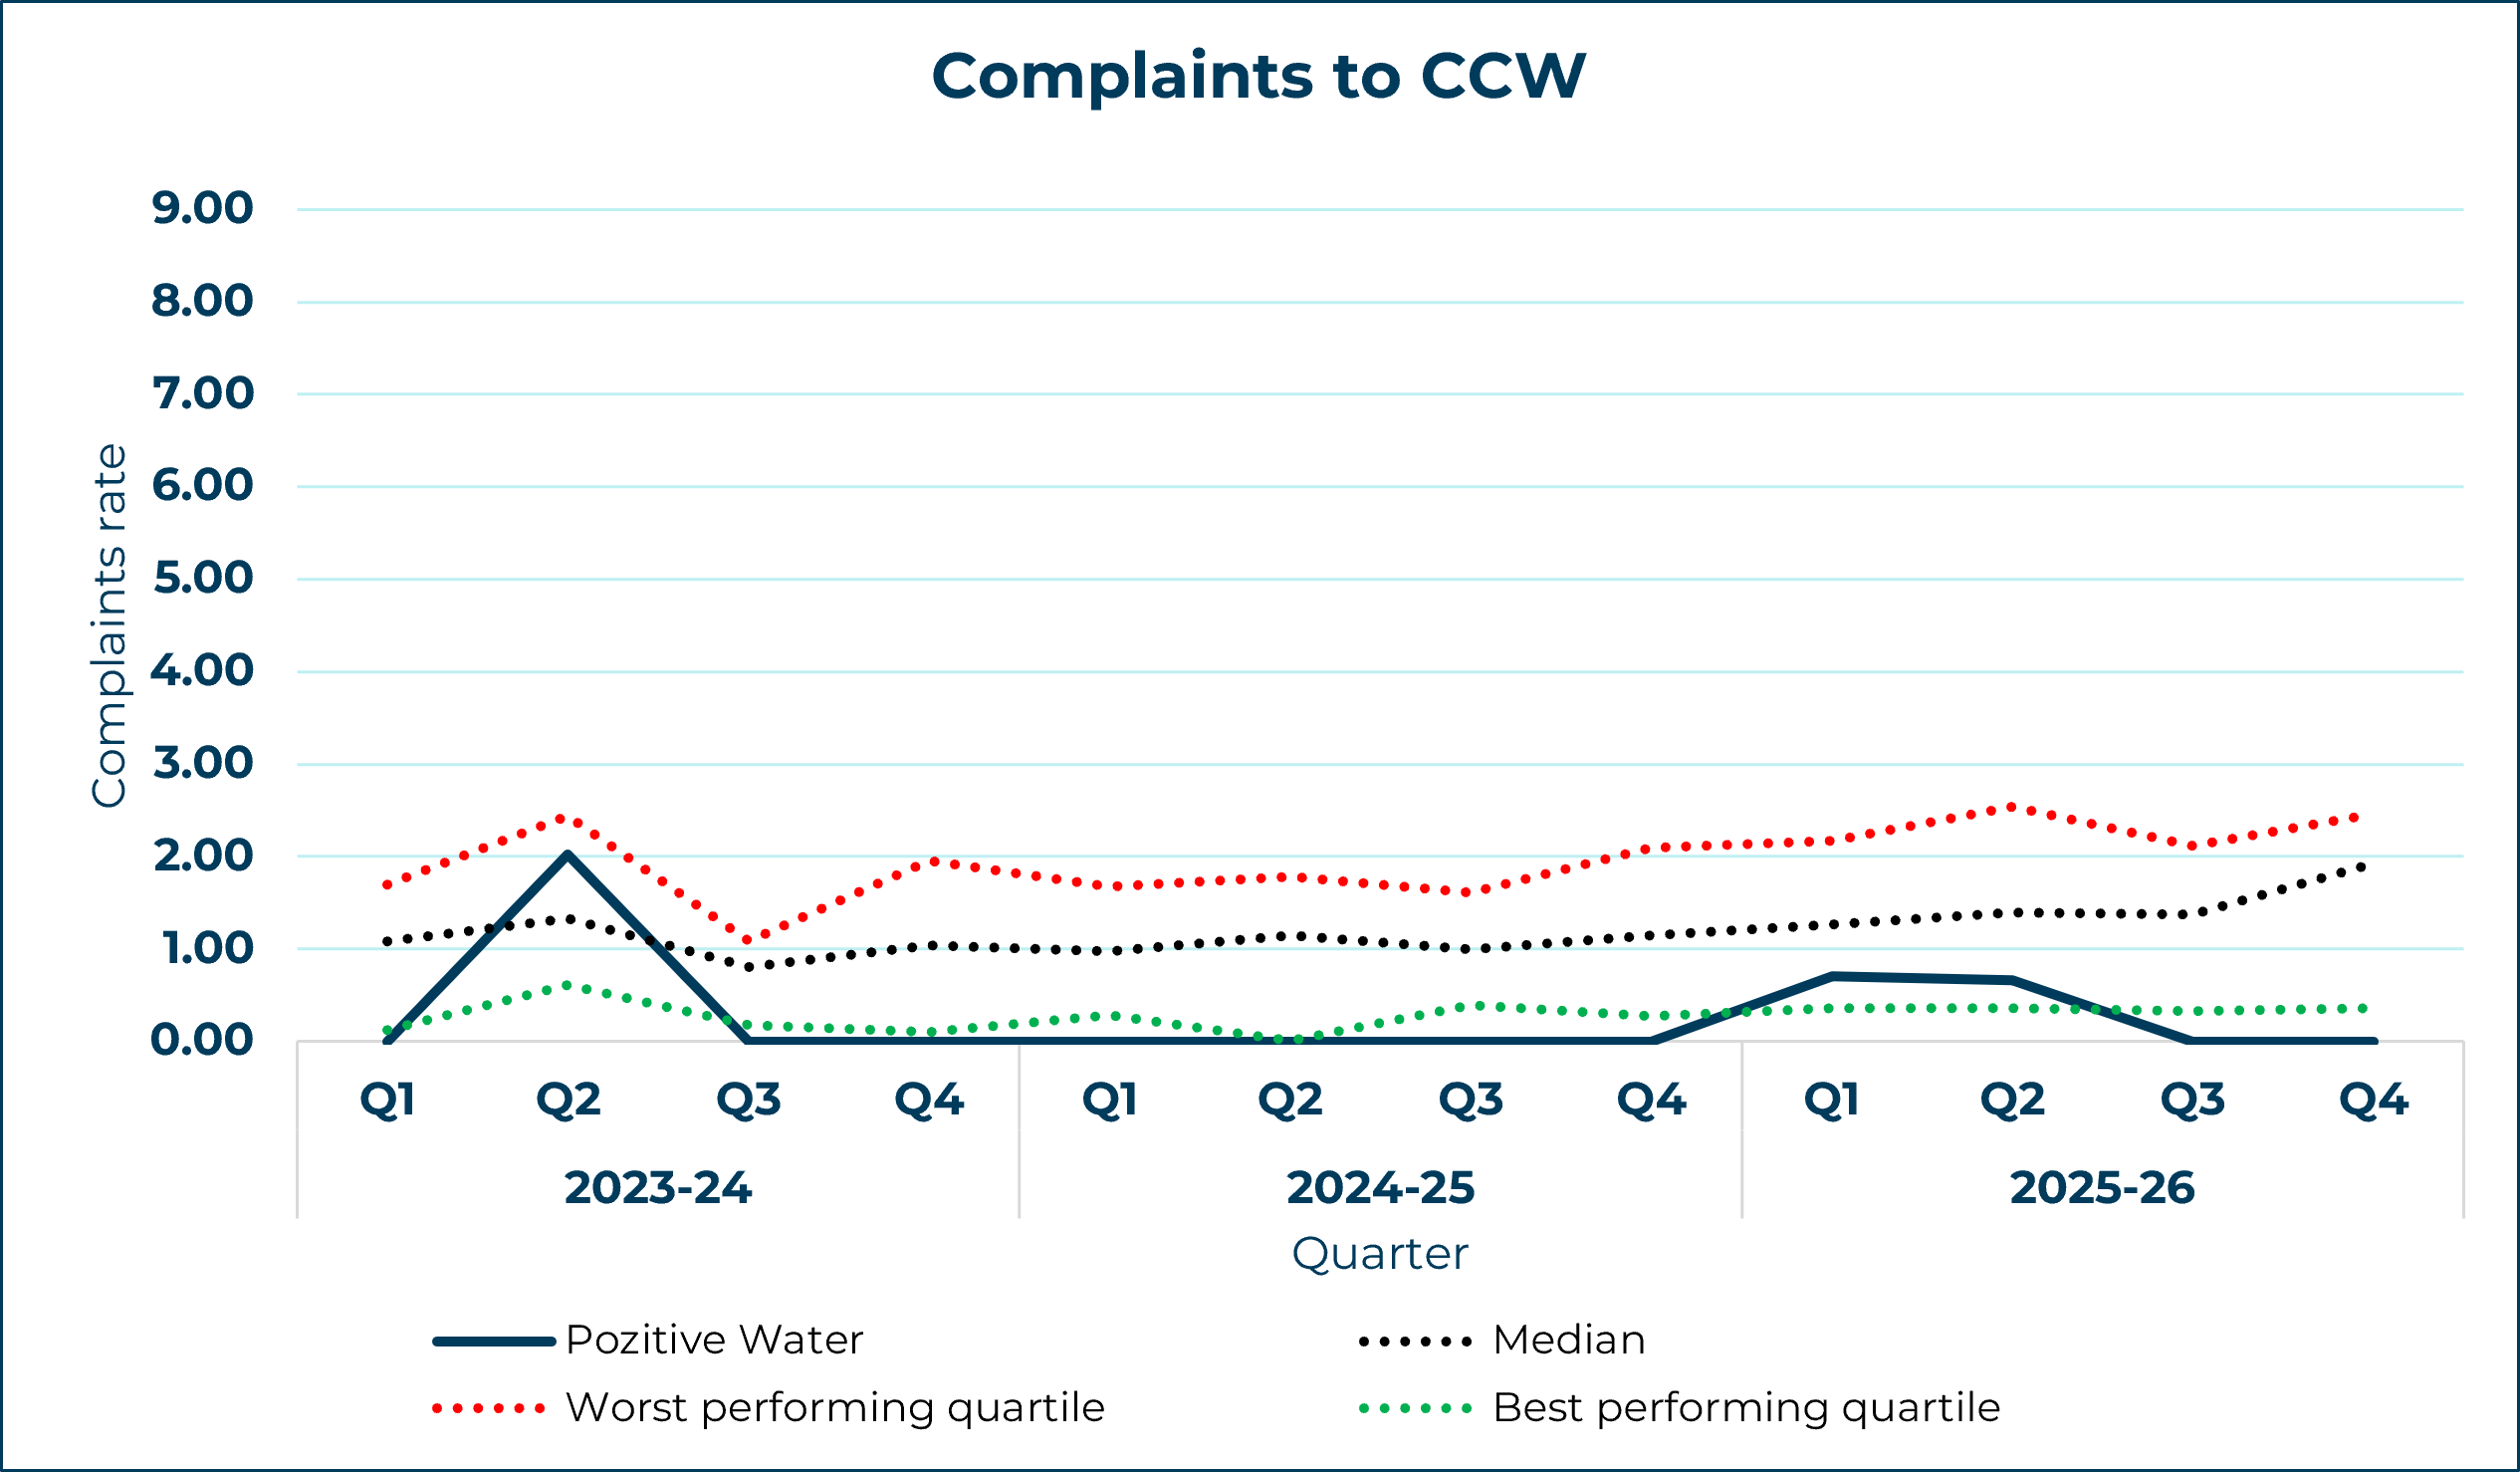
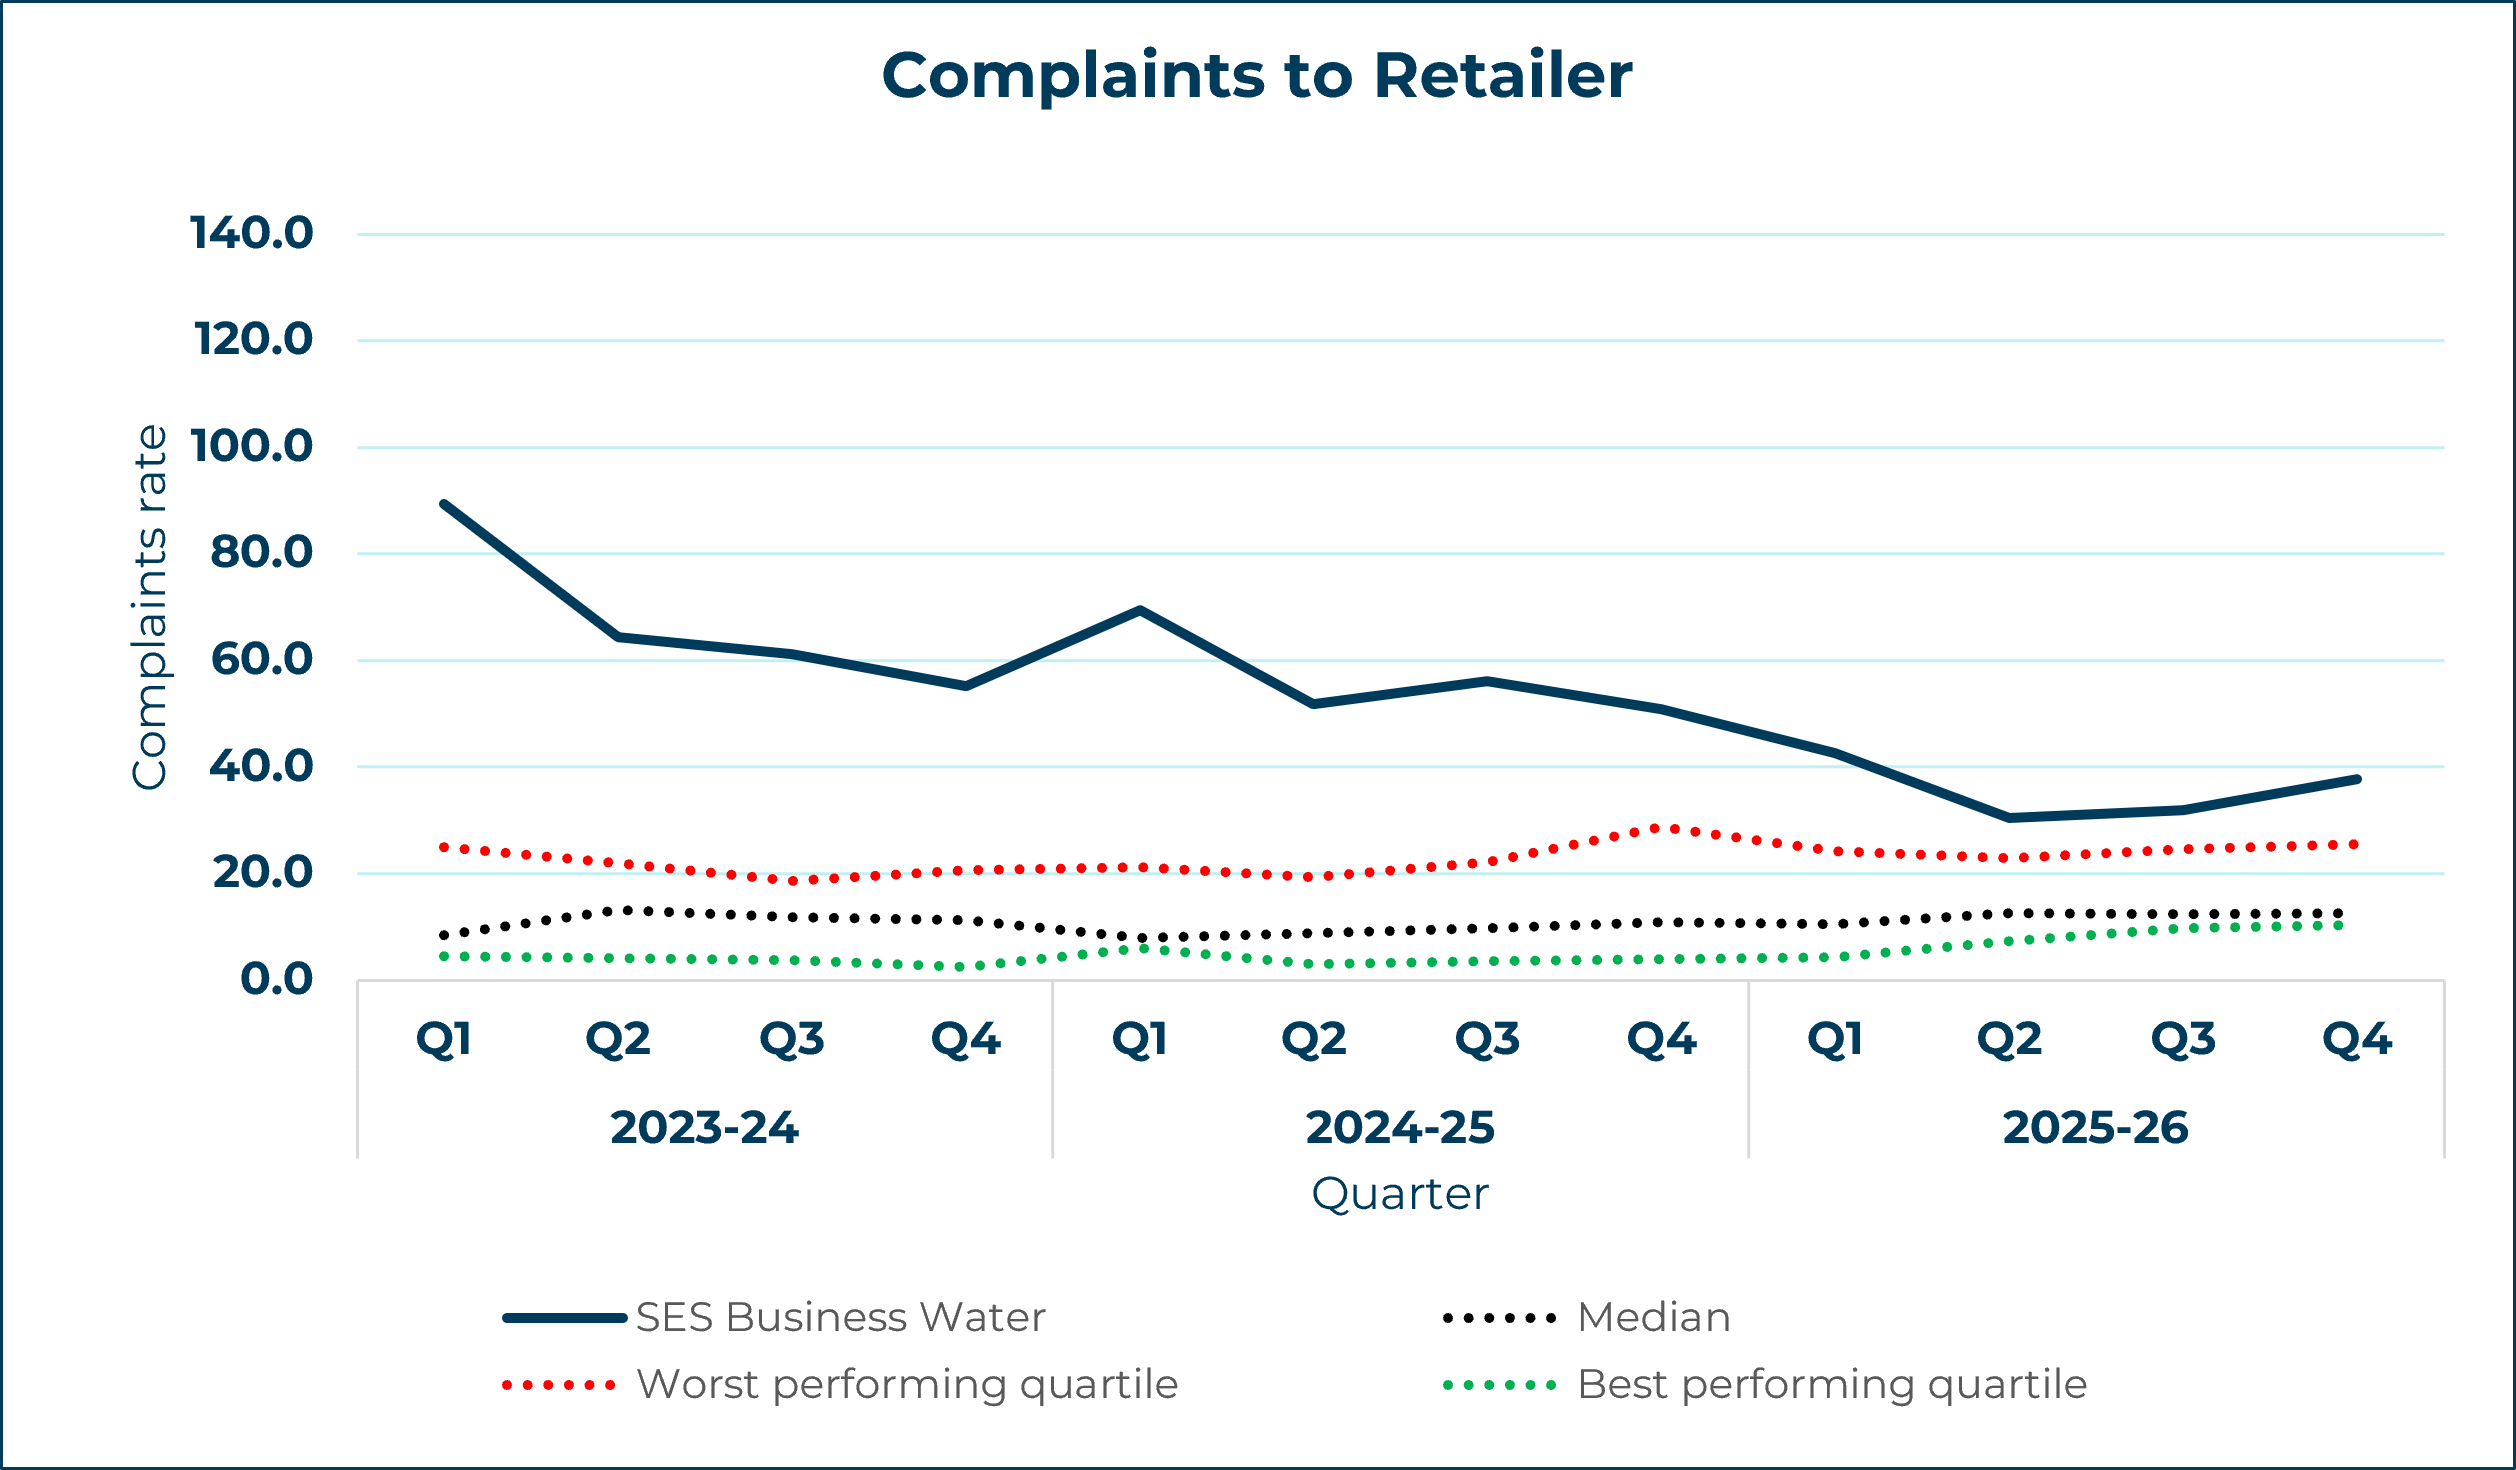
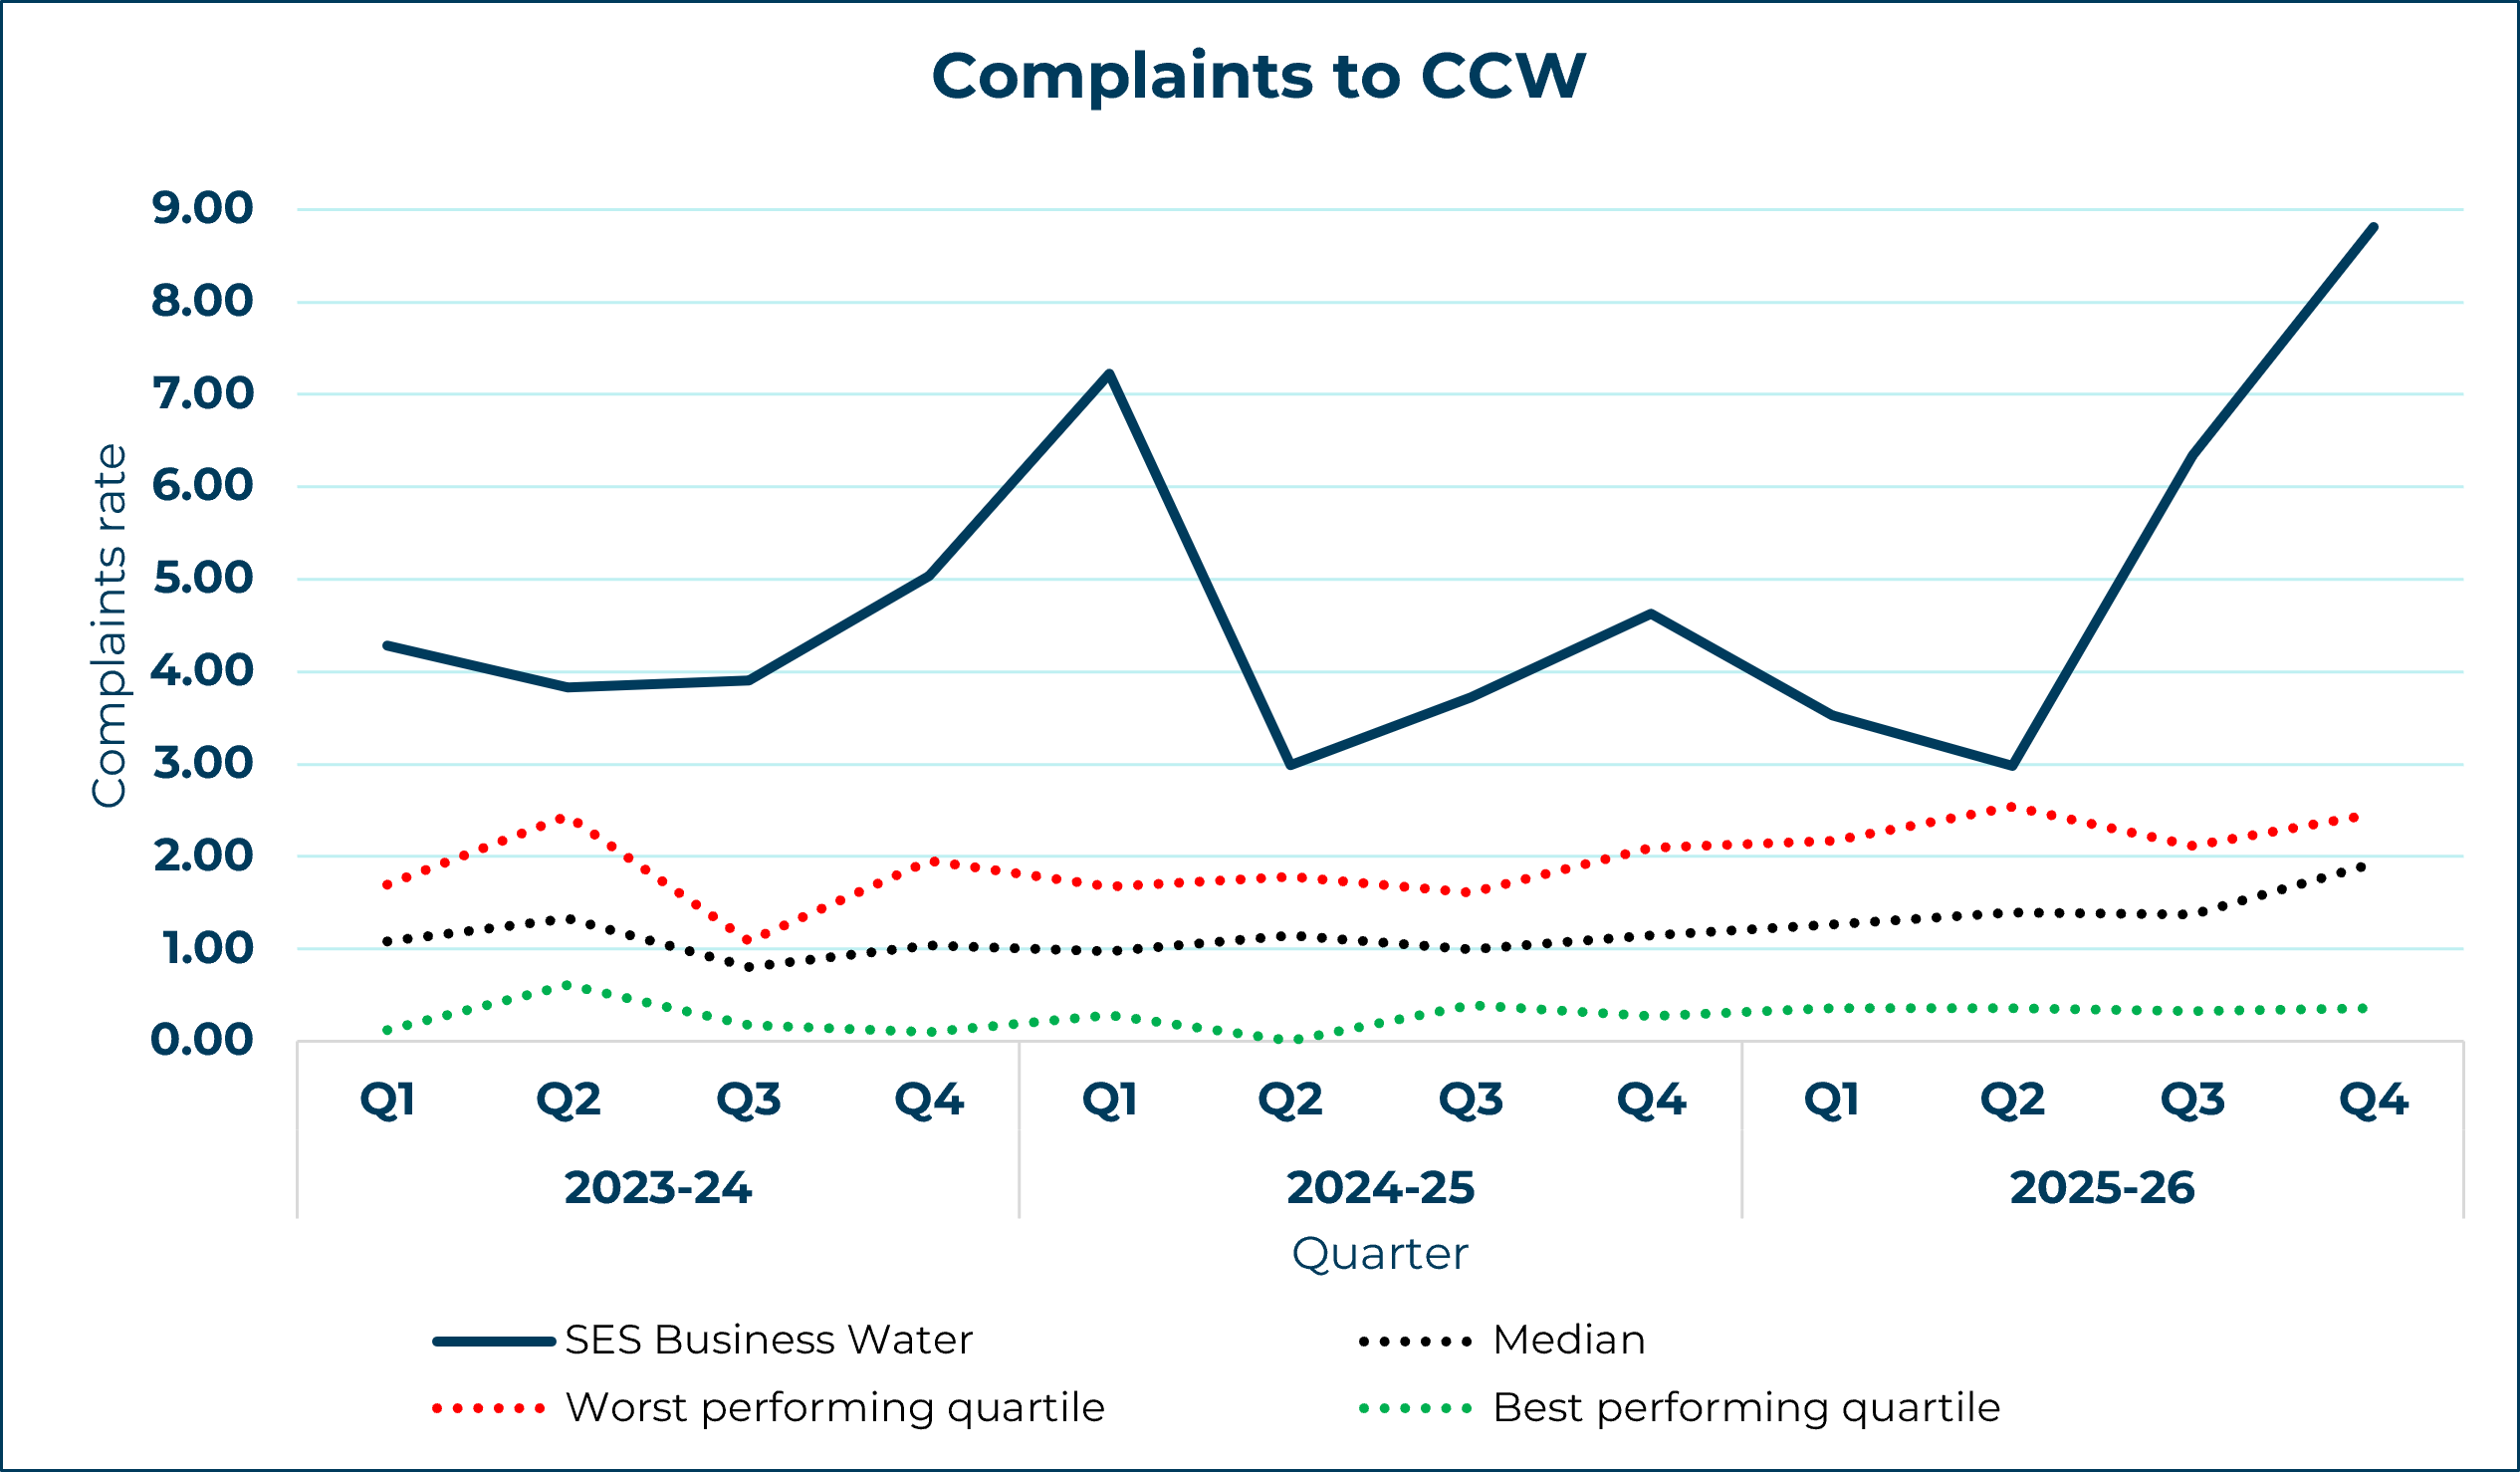
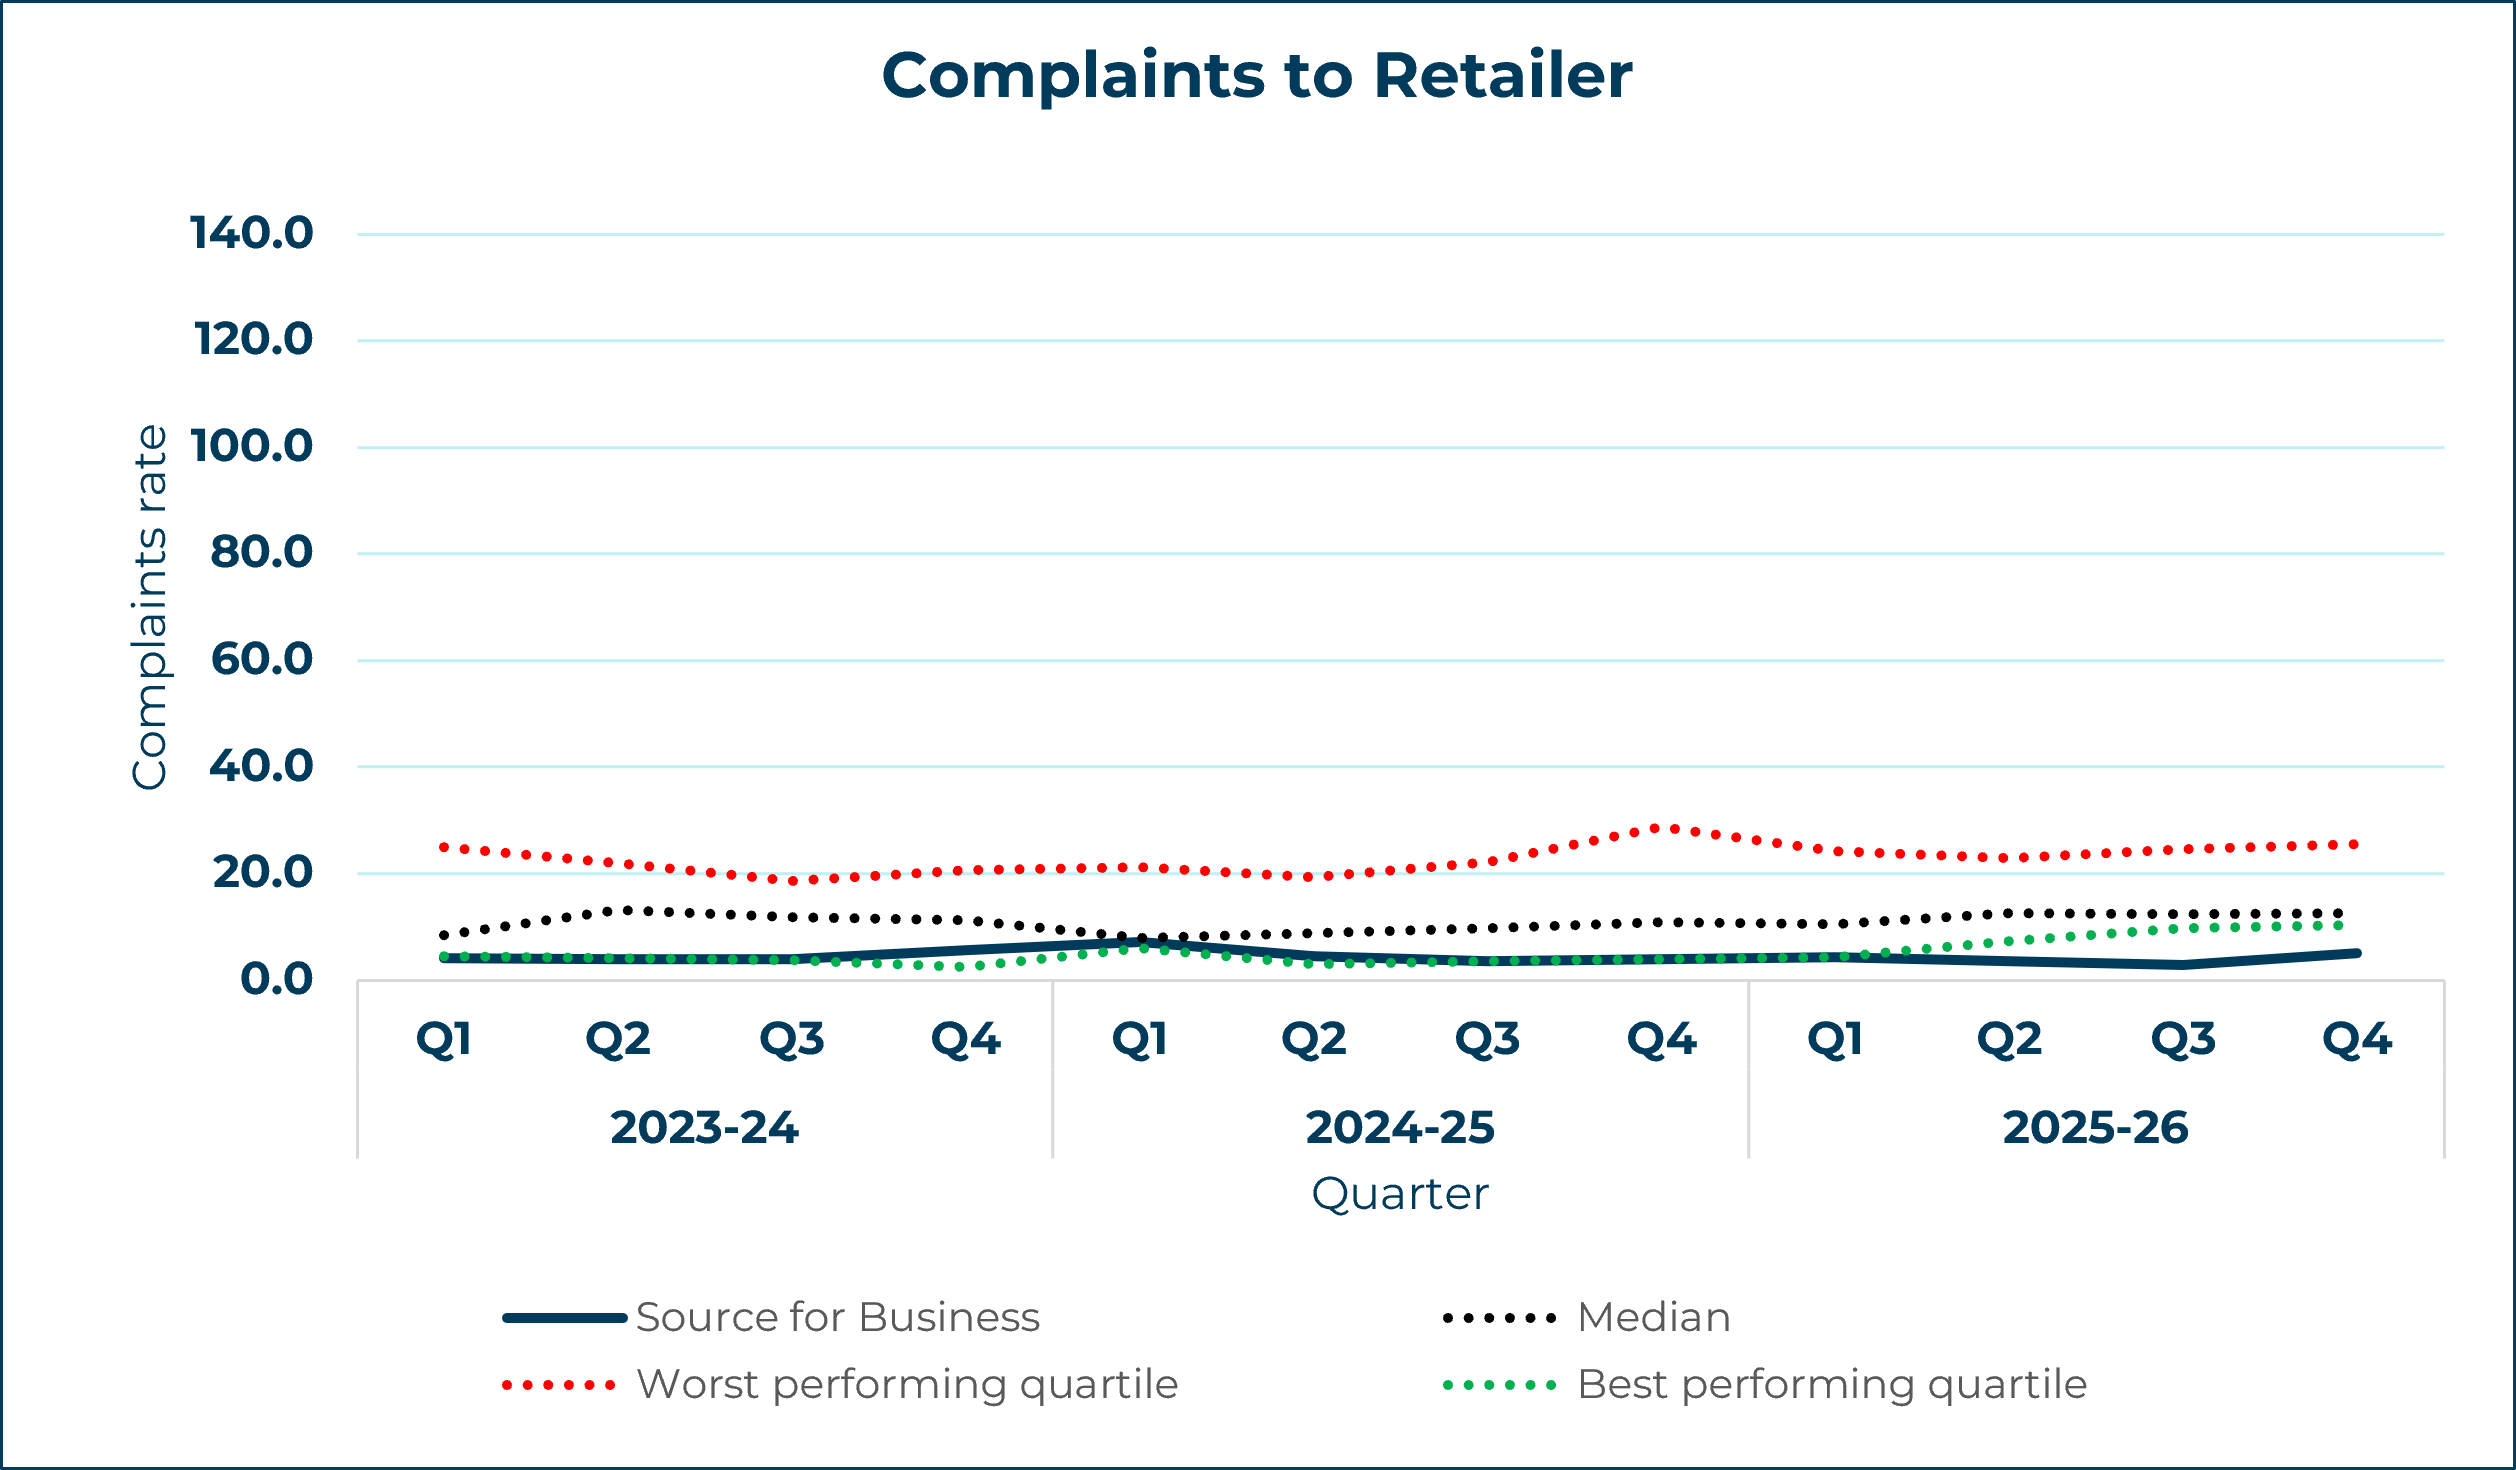
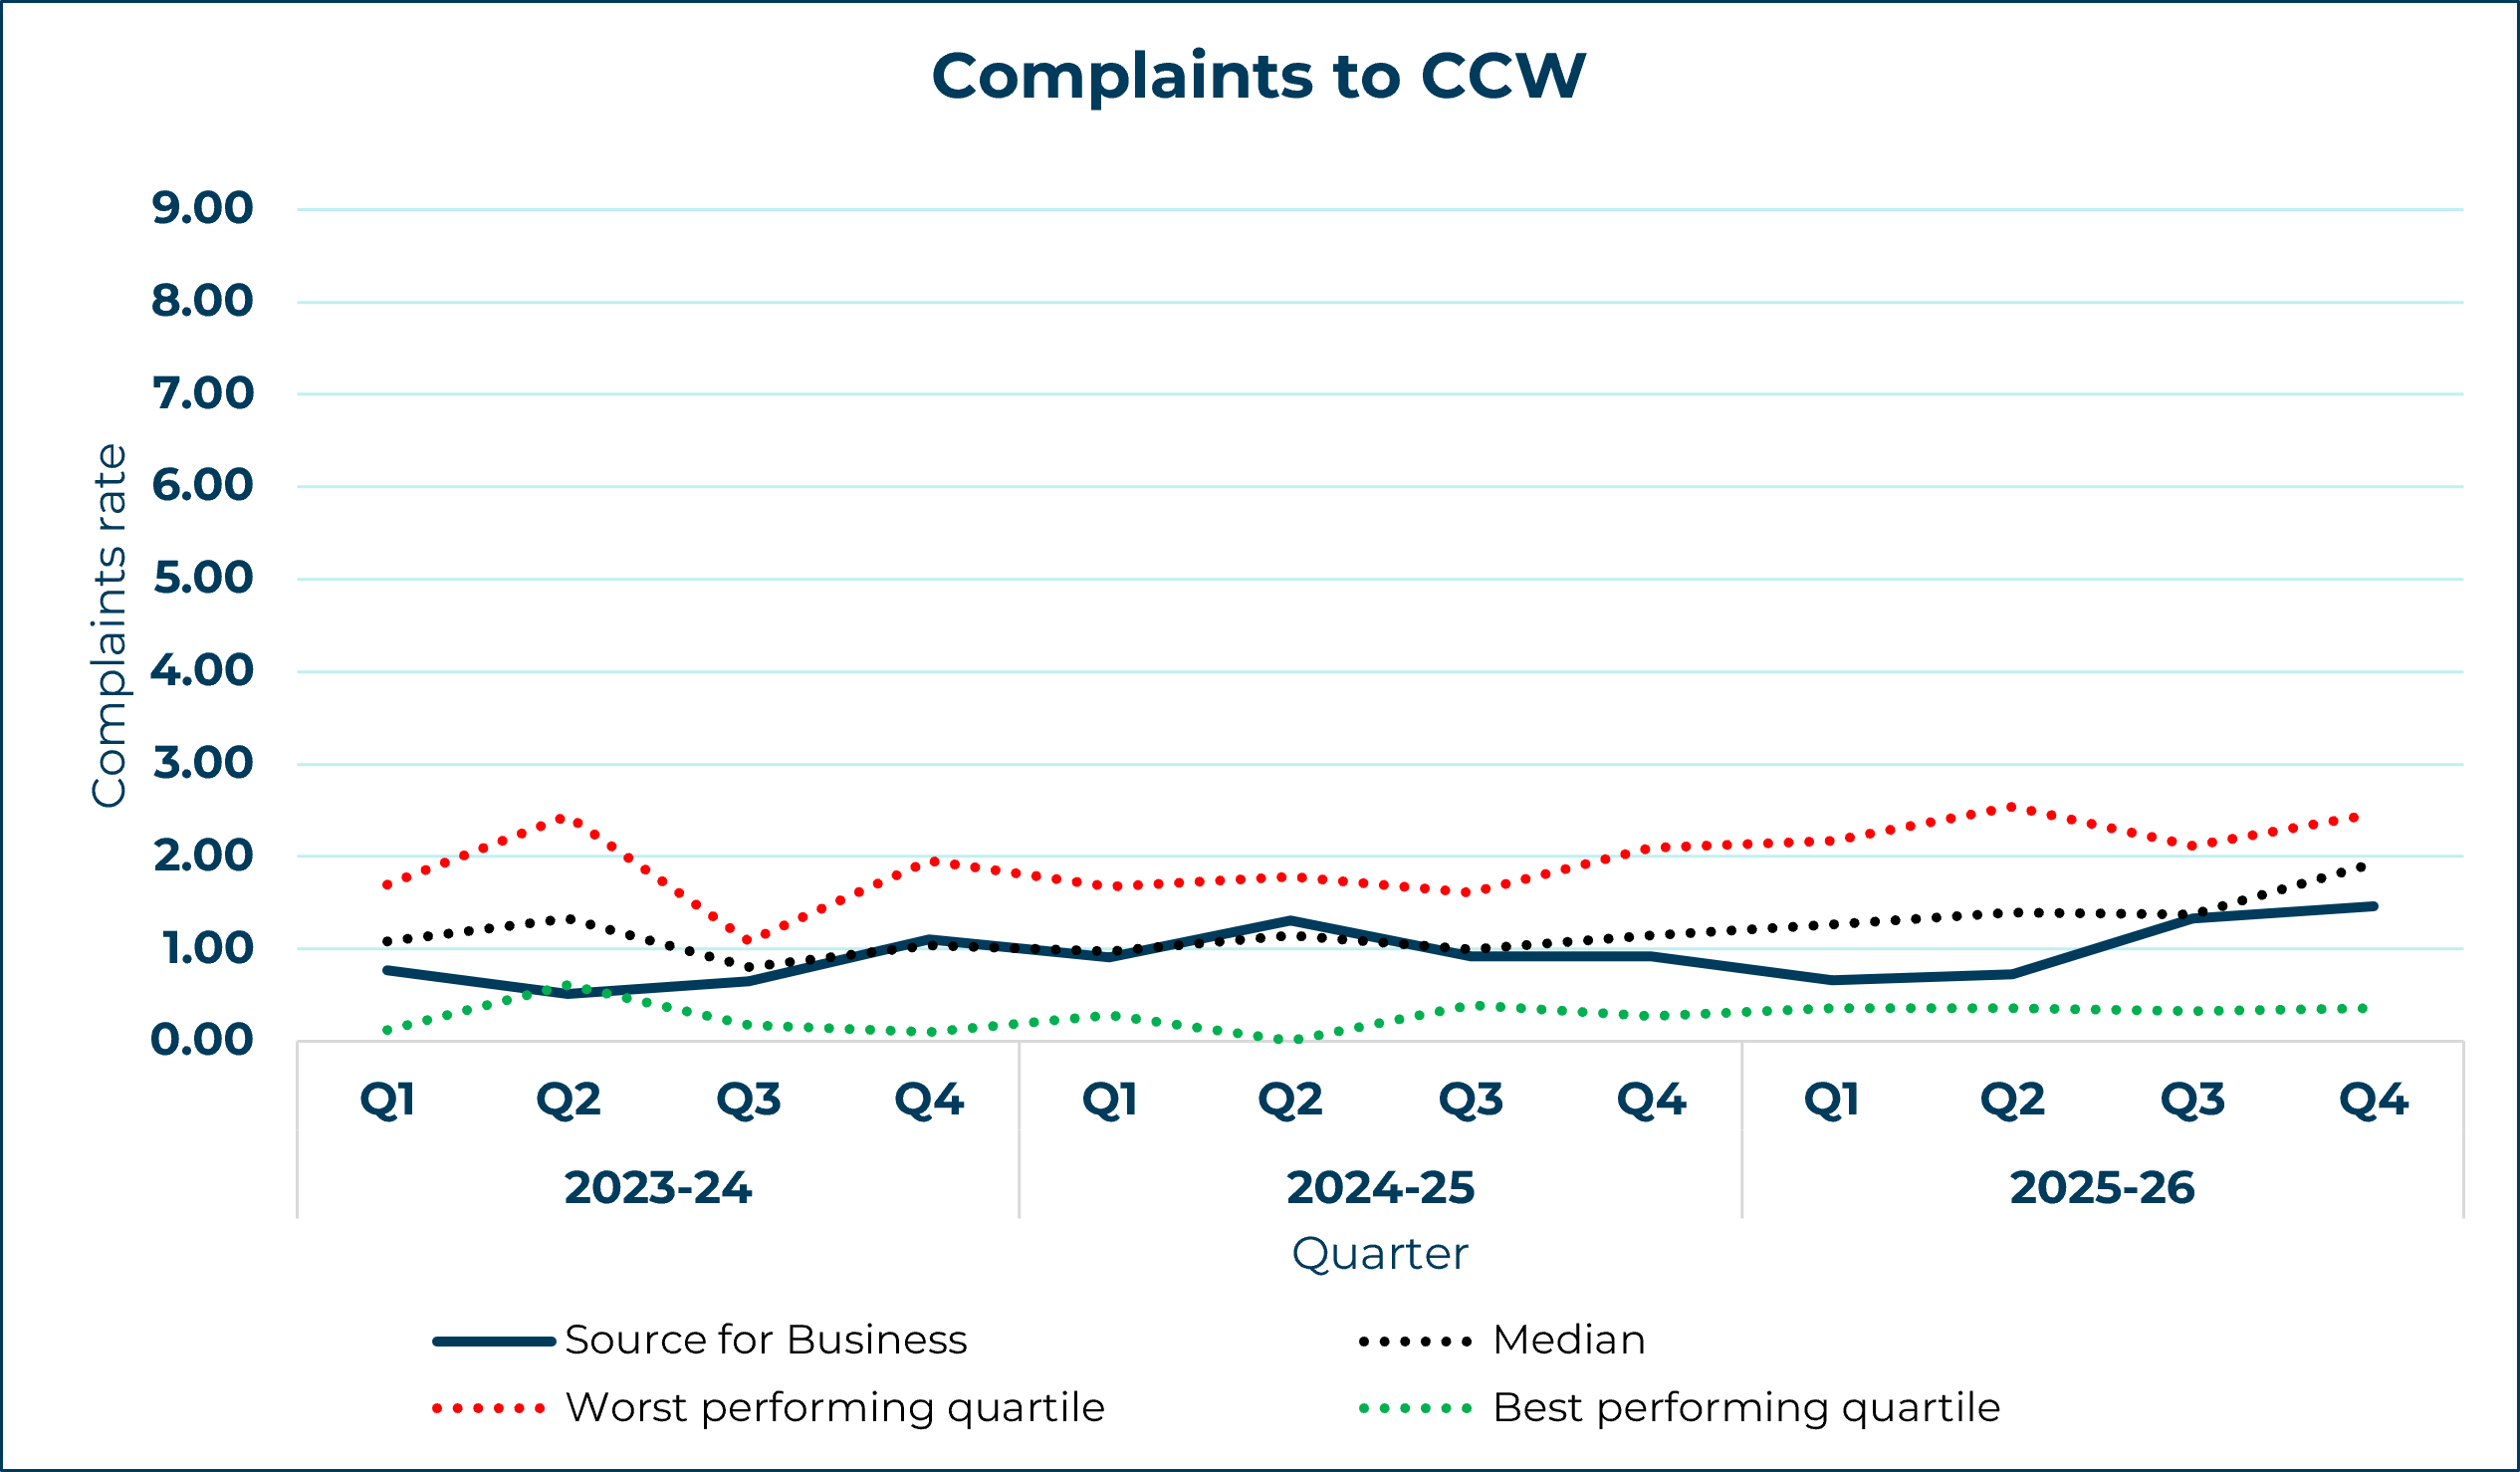
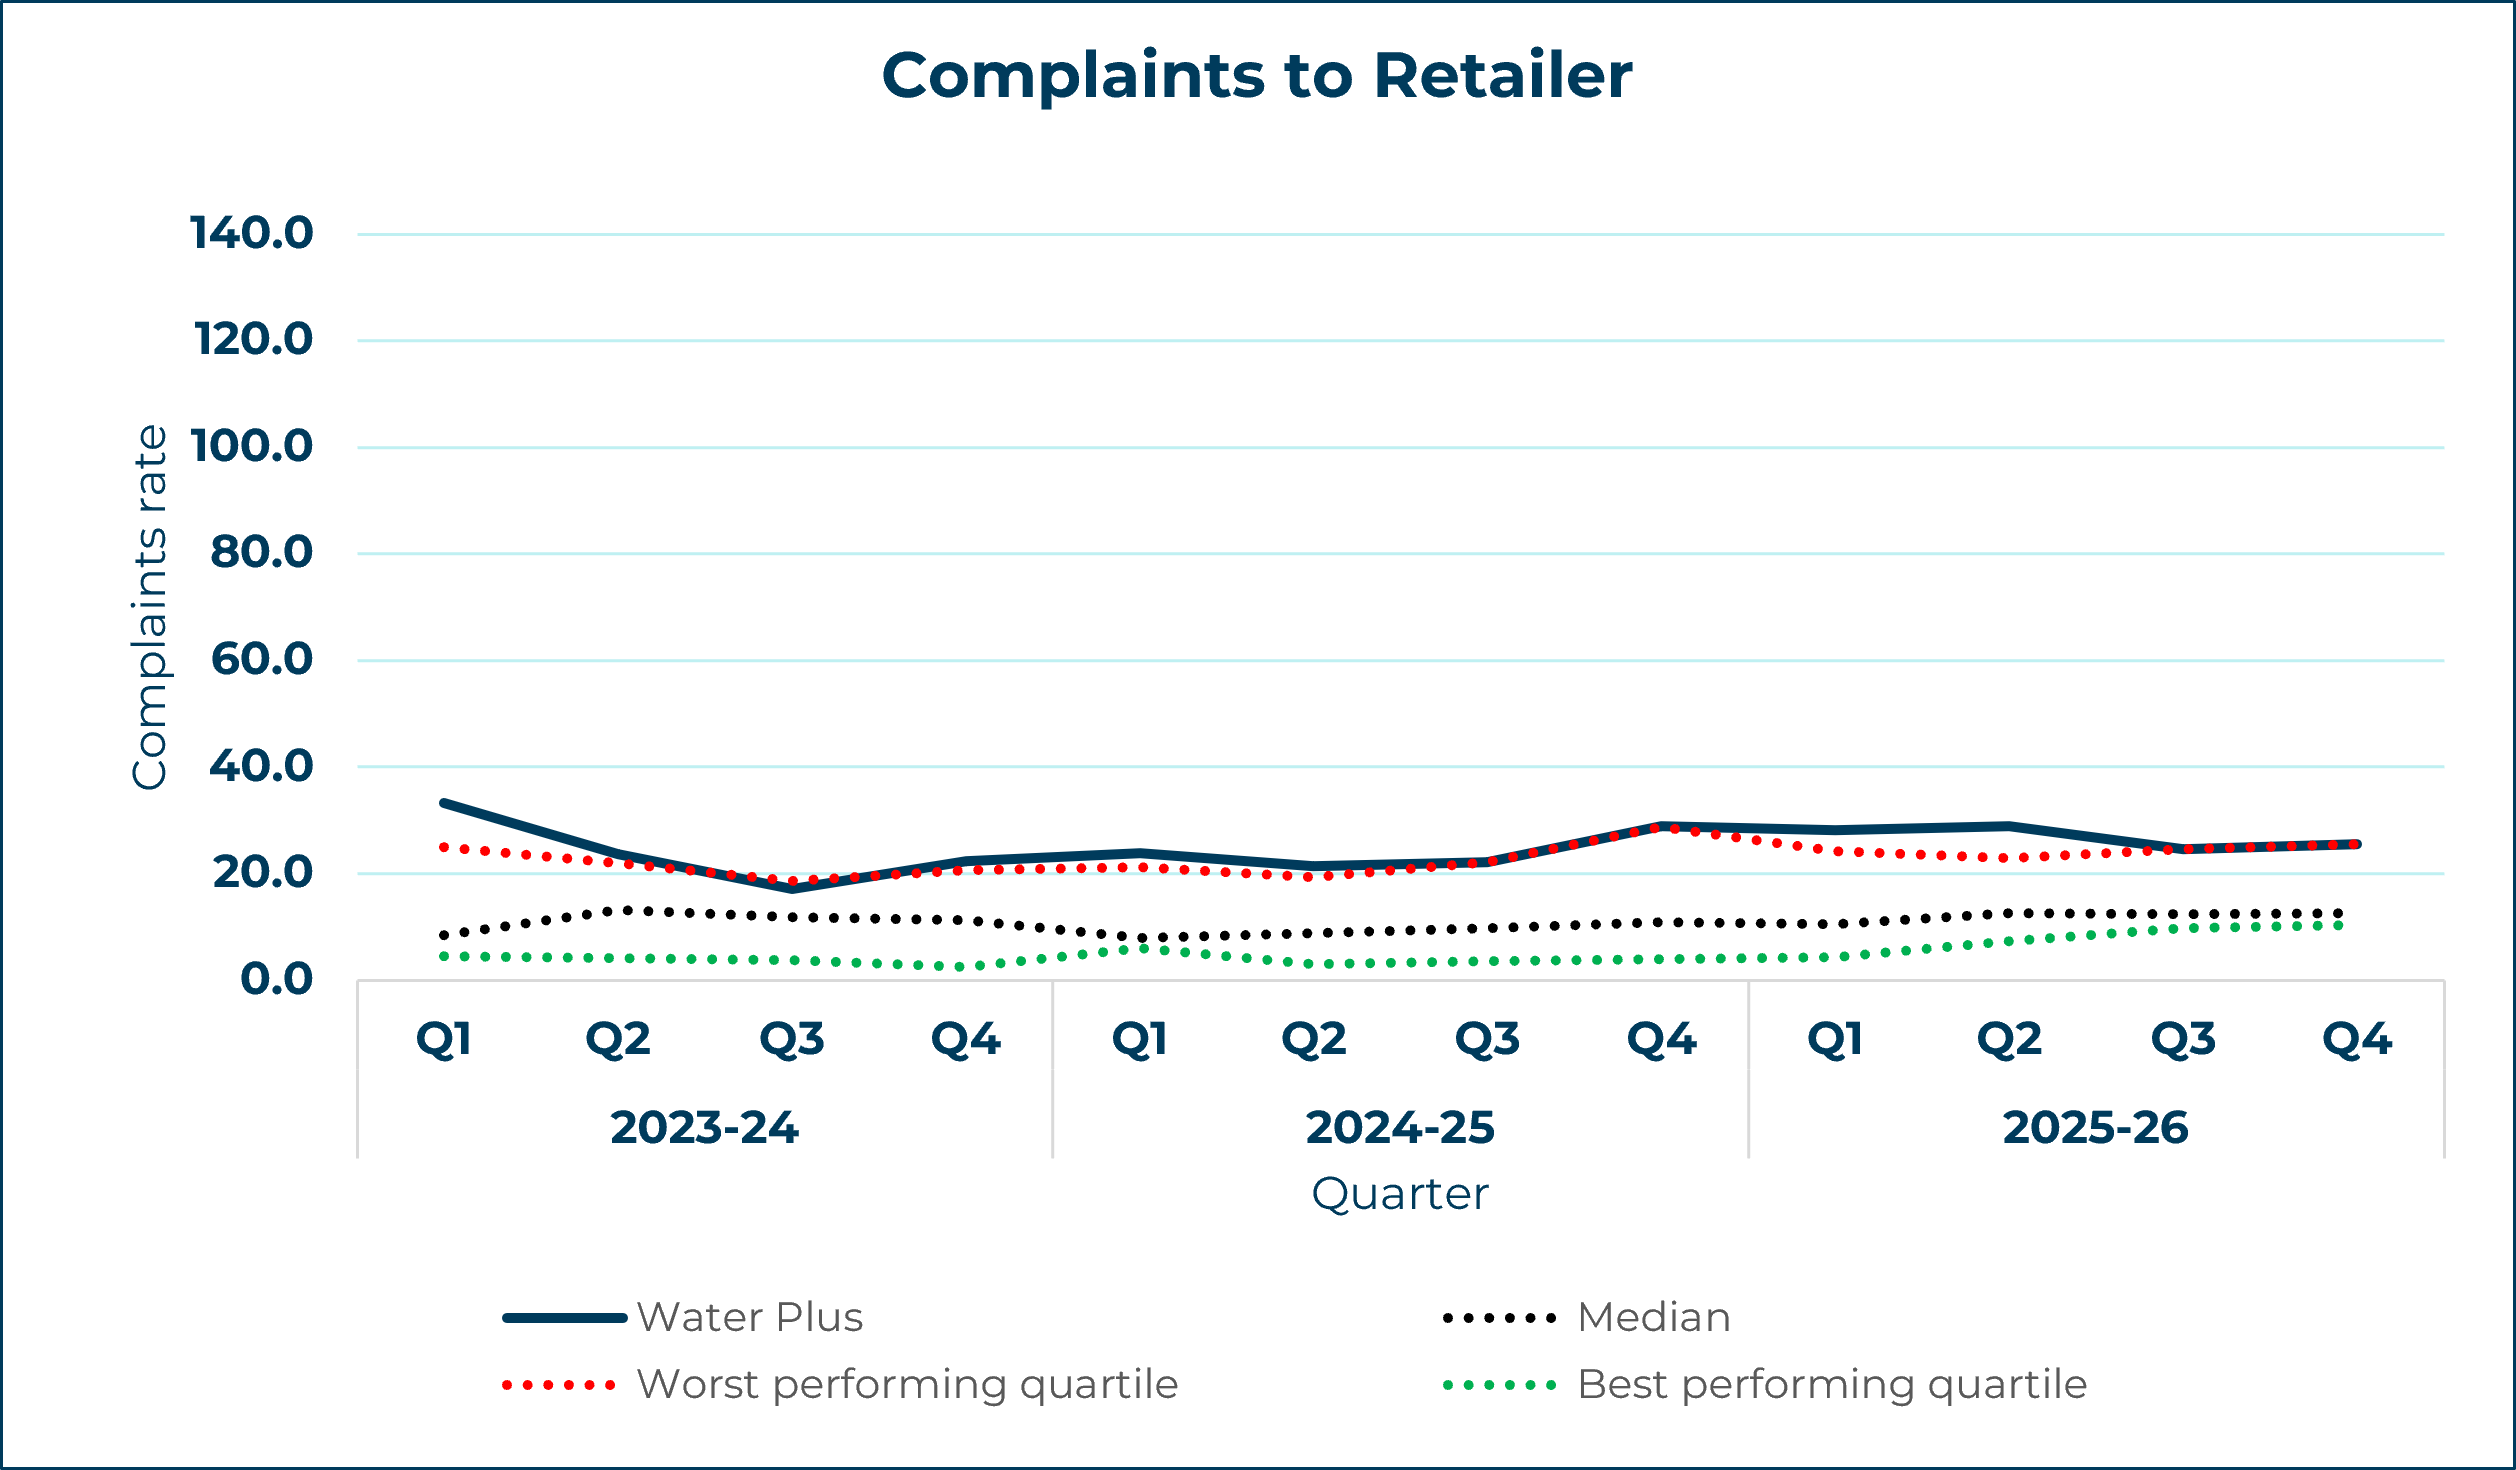
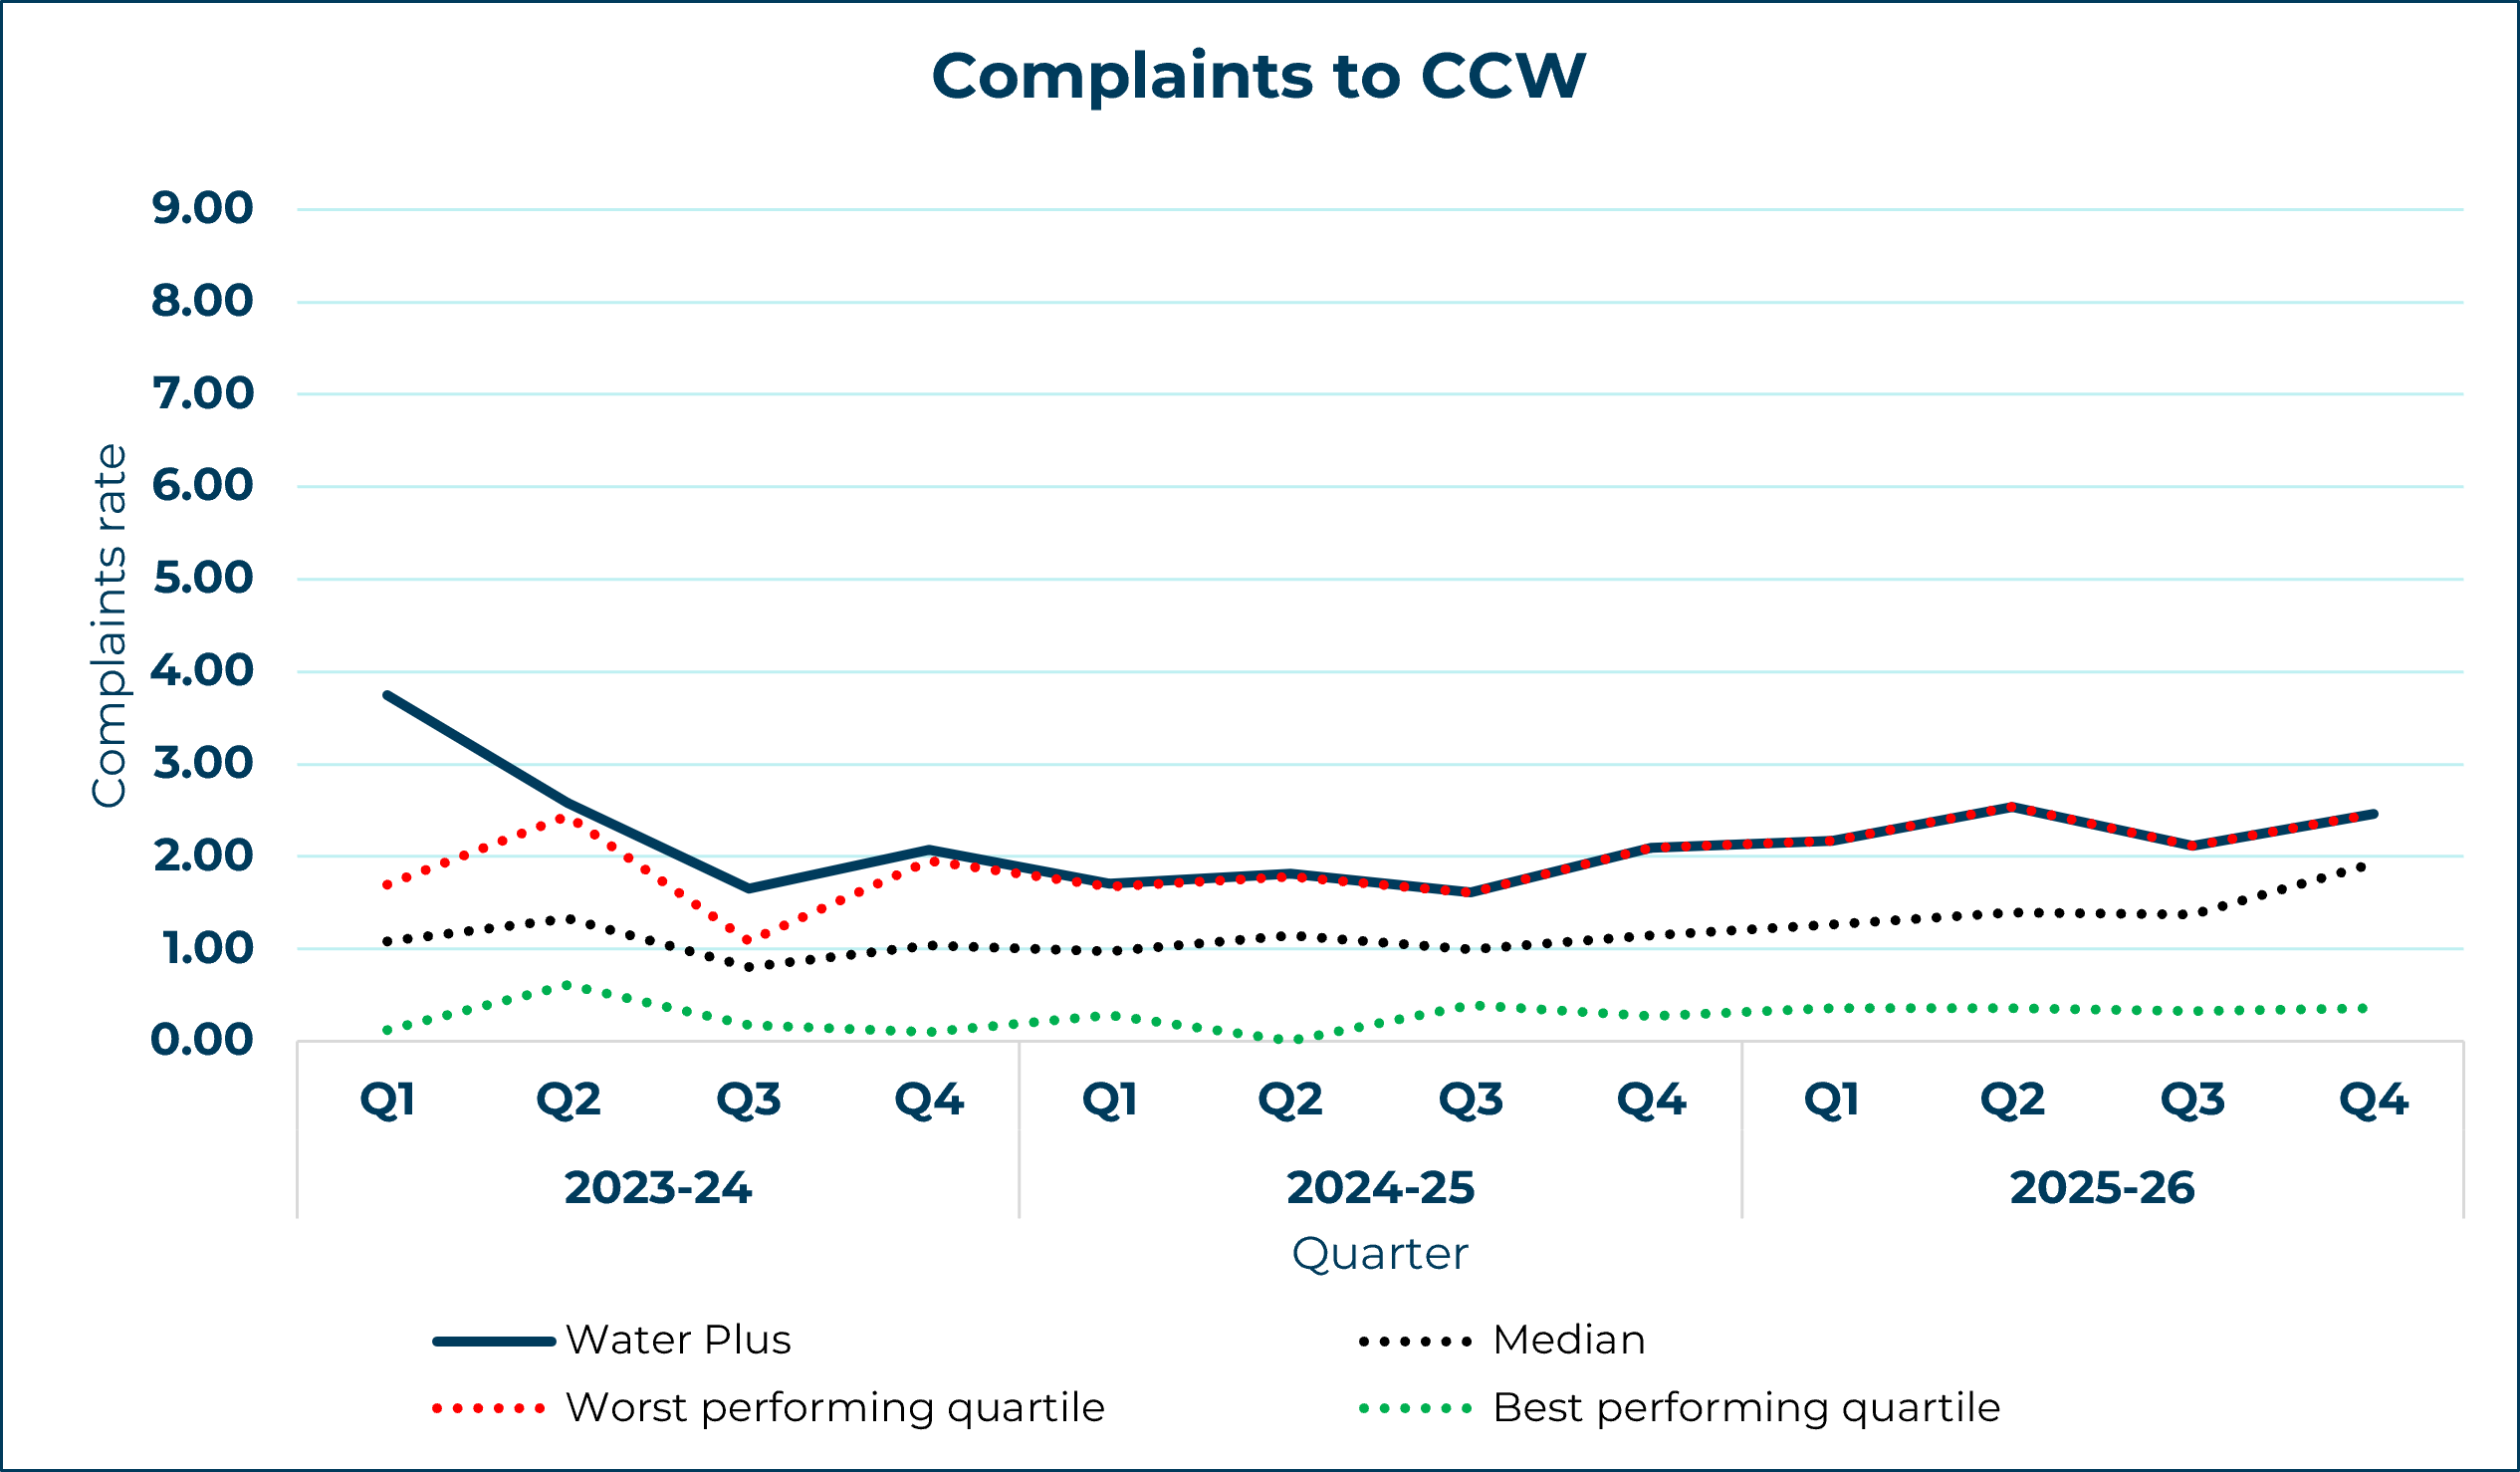
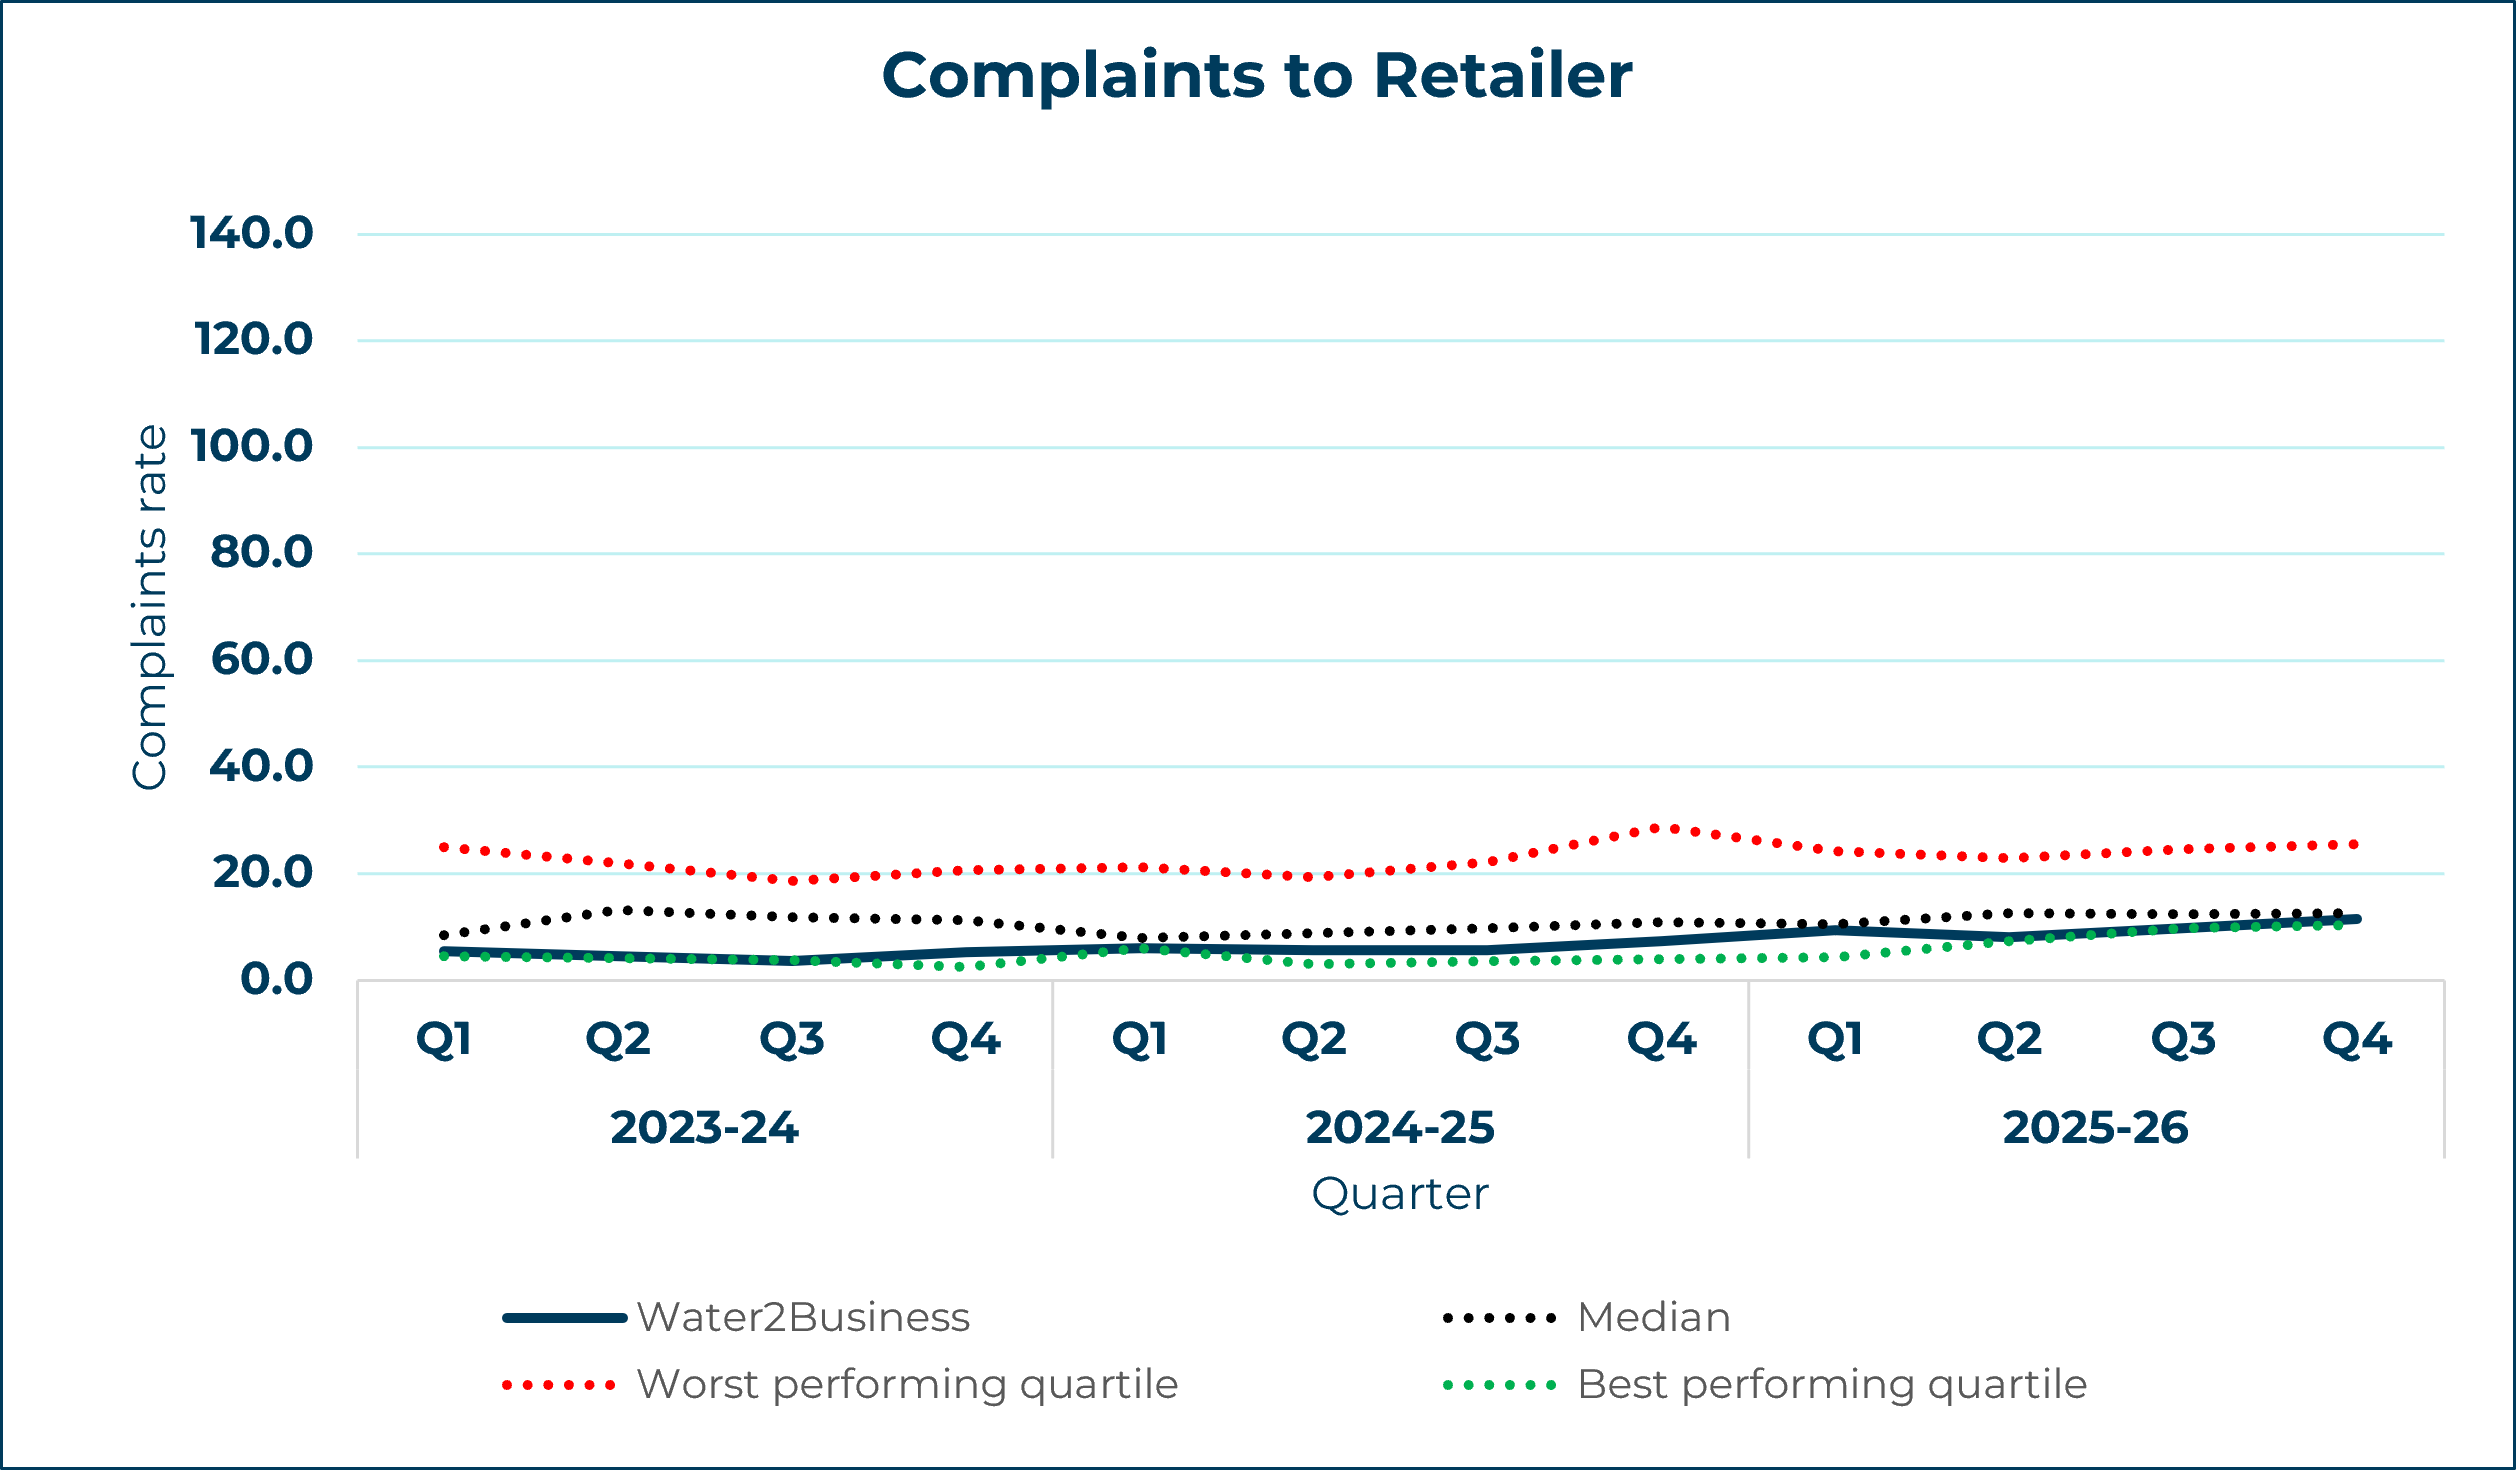
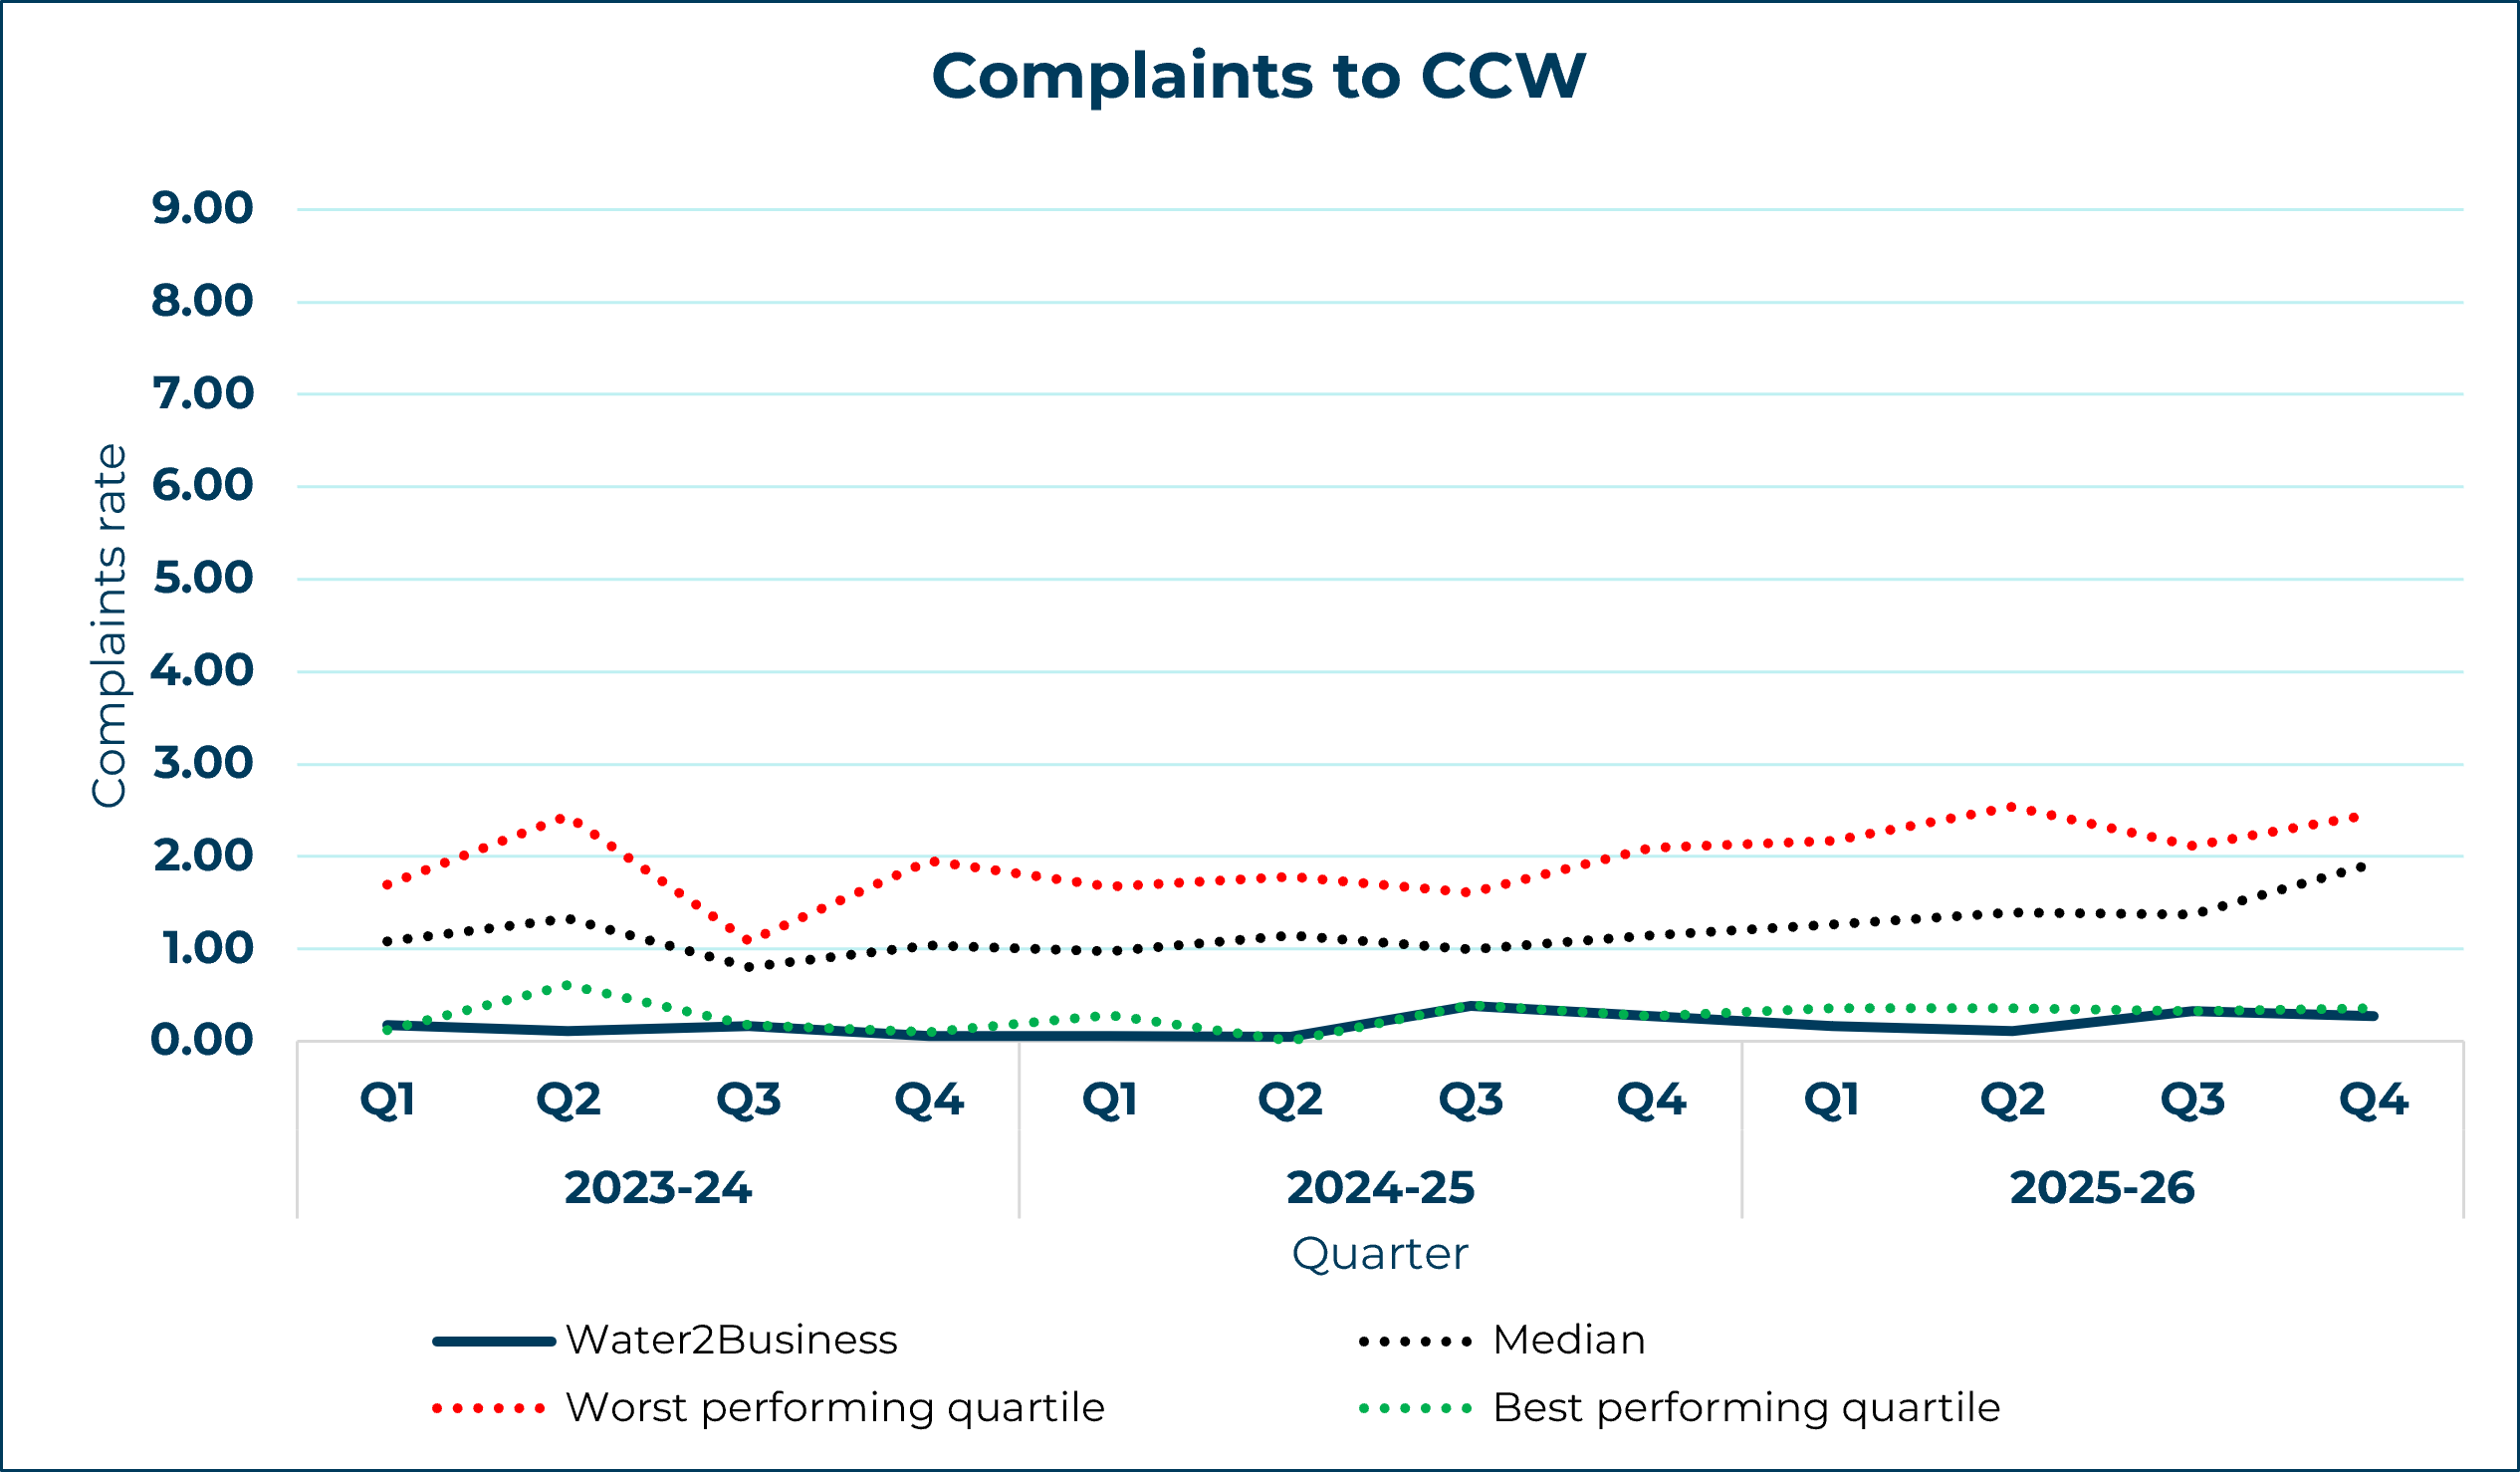
Complaint trend
Below, you’ll find graphs that track how retailer complaint trends changed over time. One graph shows complaints received by retailers per 10,000 supply points, while the other illustrates complaints reported directly to CCW per 10,000 supply points.
We can’t show complaint trends for small retailers, because we received very few complaints from them.
Key
| Retailer performance | |
| Poor – if retailer performance is above line | |
| Median* performance | |
| Good – if retailer performance is below line |
*Median – a mid-point of the data set, or a middle value in the list of numbers that are arranged by highest to lowest.
ADSM
Business Stream
Castle Water
Clear Business Water
Everflow
Pozitive Water Limited
SES Business Water
Source for Business
Water Plus
Water2Business
Wave