

How we measure performance
- For this quarterly complaints update, we use two sources to understand how companies are performing with complaints:
- complaints received directly by the companies; and
- complaints raised directly to CCW about the companies
This update focuses on the complaints performance for the current year, 2025-26.
How we compare performance
To compare companies of different sizes, we use a metric called ‘complaints per 10,000 connections’. This metric takes into account the number of water and wastewater connections each company serves.
For example, if Company A received 600 complaints and has 4,000,000 total connections, the calculation would be:
Complaints per 10,000 connections = 600/4,000,000 x 10,000 = 1.5
Comparative performance: we compare the performance of individual companies within their respective segments as either Water and Sewerage Companies (WaSCs) or Water Only Companies (WOCs).
Important note: the data in this publication is unaudited and a subject to change at the end of the year.
| How we measure |
|---|
| Quartile 1 – Good |
| Quartile 2 – Better than median* |
| Quartile 3 – At or worse than median* |
| Quartile 4 – Poor |
*Median – a mid-point of the data set, or a middle value in the list of numbers that are arranged by highest to lowest.
Water and sewerage companies’ performance in 2025-26 (April to December 2025)
| Company | Household connections | Complaints to company | Per 10k (company) | Complaints to CCW | Per 10k (to CCW) |
|---|---|---|---|---|---|
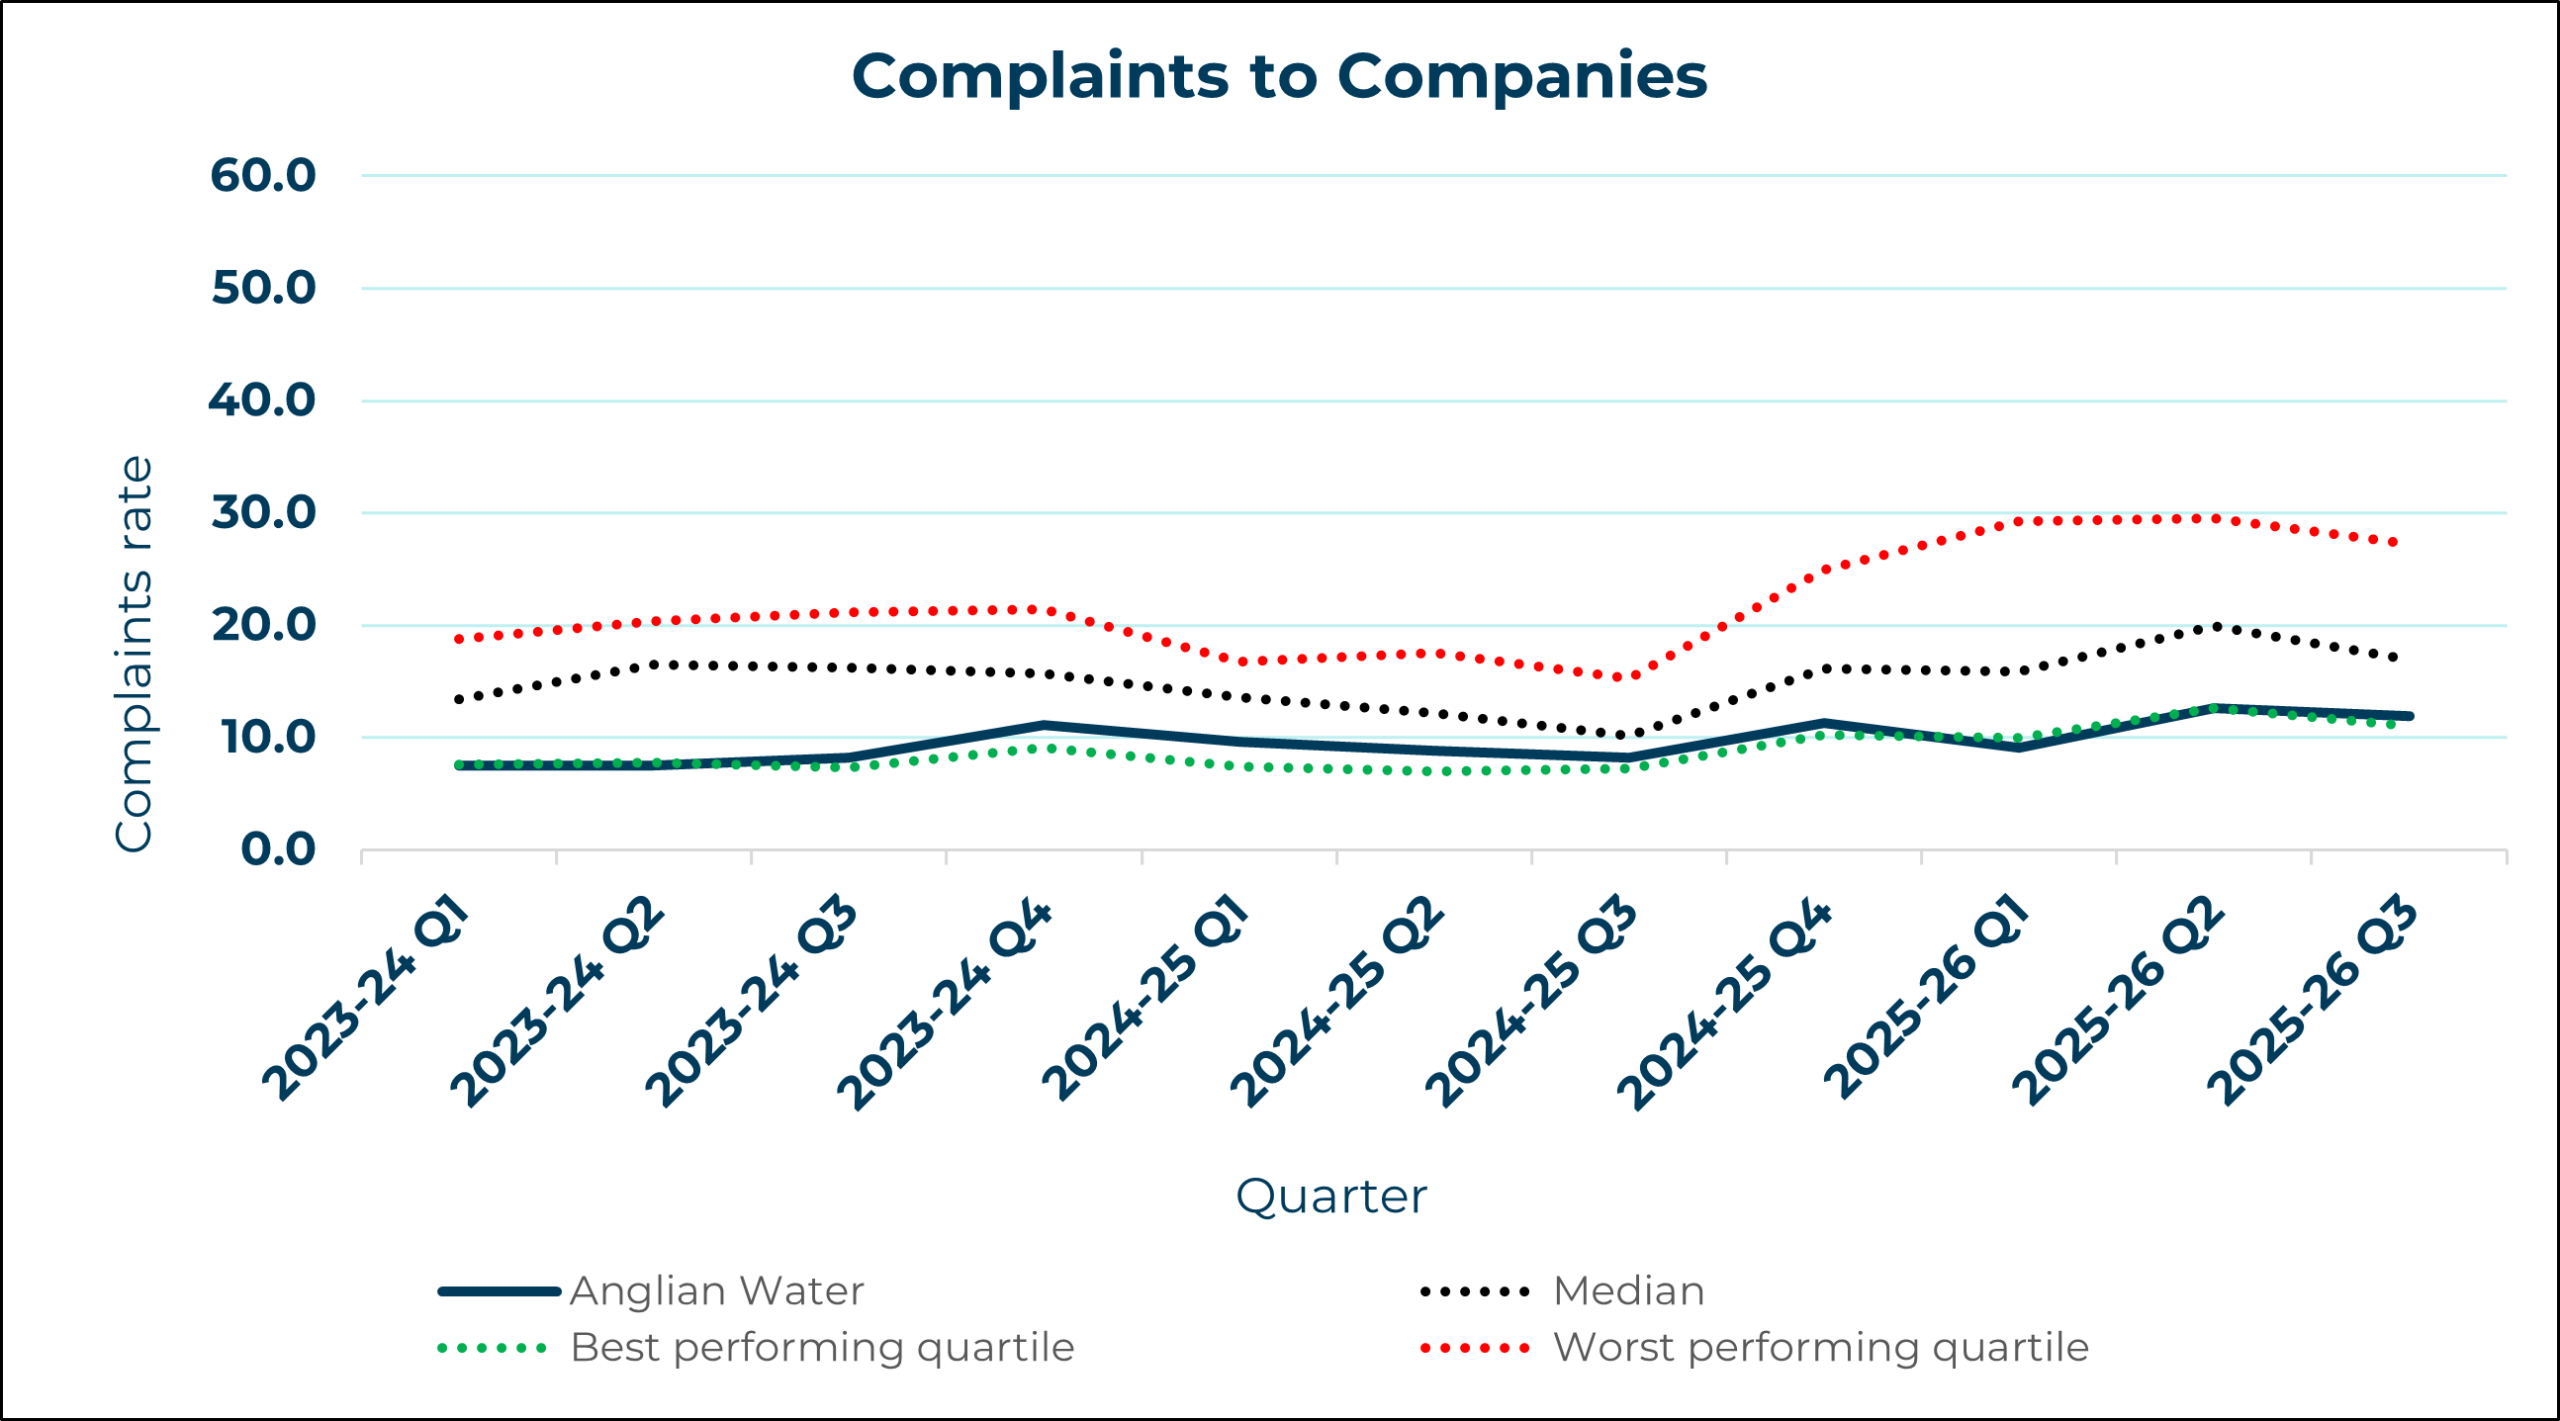
| Anglian Water | 3,112,980 | 10,487 | 33.69 | 566 | 1.82 |
| Dŵr Cymru Welsh Water | 1,504,167 | 8,505 | 56.54 | 436 | 2.90 |
| Hafren Dyfrdwy | 101,194 | 133 | 13.14 | 22 | 2.17 |
| Northumbrian Water | 1,278,357 | 3,994 | 31.24 | 79 | 0.62 |
| Severn Trent Water | 4,386,041 | 13,556 | 30.91 | 1,409 | 3.21 |
| South West Water | 1,029,624 | 15,087 | 146.53 | 524 | 5.09 |
| Southern Water | 2,088,159 | 16,432 | 78.69 | 973 | 4.66 |
| Thames Water | 6,043,396 | 86,442 | 143.04 | 3,679 | 6.09 |
| United Utilities | 3,390,859 | 20,232 | 59.67 | 663 | 1.96 |
| Wessex Water | 1,286,235 | 4,832 | 37.57 | 93 | 0.72 |
| Yorkshire Water | 2,399,641 | 22,388 | 93.30 | 784 | 3.27 |
Water only companies’ performance in 2025-26 (April to December 2025)
| Company | Household connections | Complaints to company | Per 10k (company) | Complaints to CCW | Per 10k (to CCW) |
|---|---|---|---|---|---|
| Affinity Water | 1,520,312 | 13,008 | 85.56 | 513 | 3.37 |
| Bristol Water | 530,130 | 1,973 | 37.22 | 37 | 0.70 |
| Cambridge Water | 143,800 | 788 | 54.80 | 38 | 2.64 |
| Essex & Suffolk Water | 803,987 | 3,410 | 42.41 | 95 | 1.18 |
| Portsmouth Water | 311,663 | 562 | 18.03 | 29 | 0.93 |
| SES Water | 289,973 | 1,600 | 55.18 | 137 | 4.72 |
| South East Water | 1,022,450 | 5,814 | 56.86 | 248 | 2.43 |
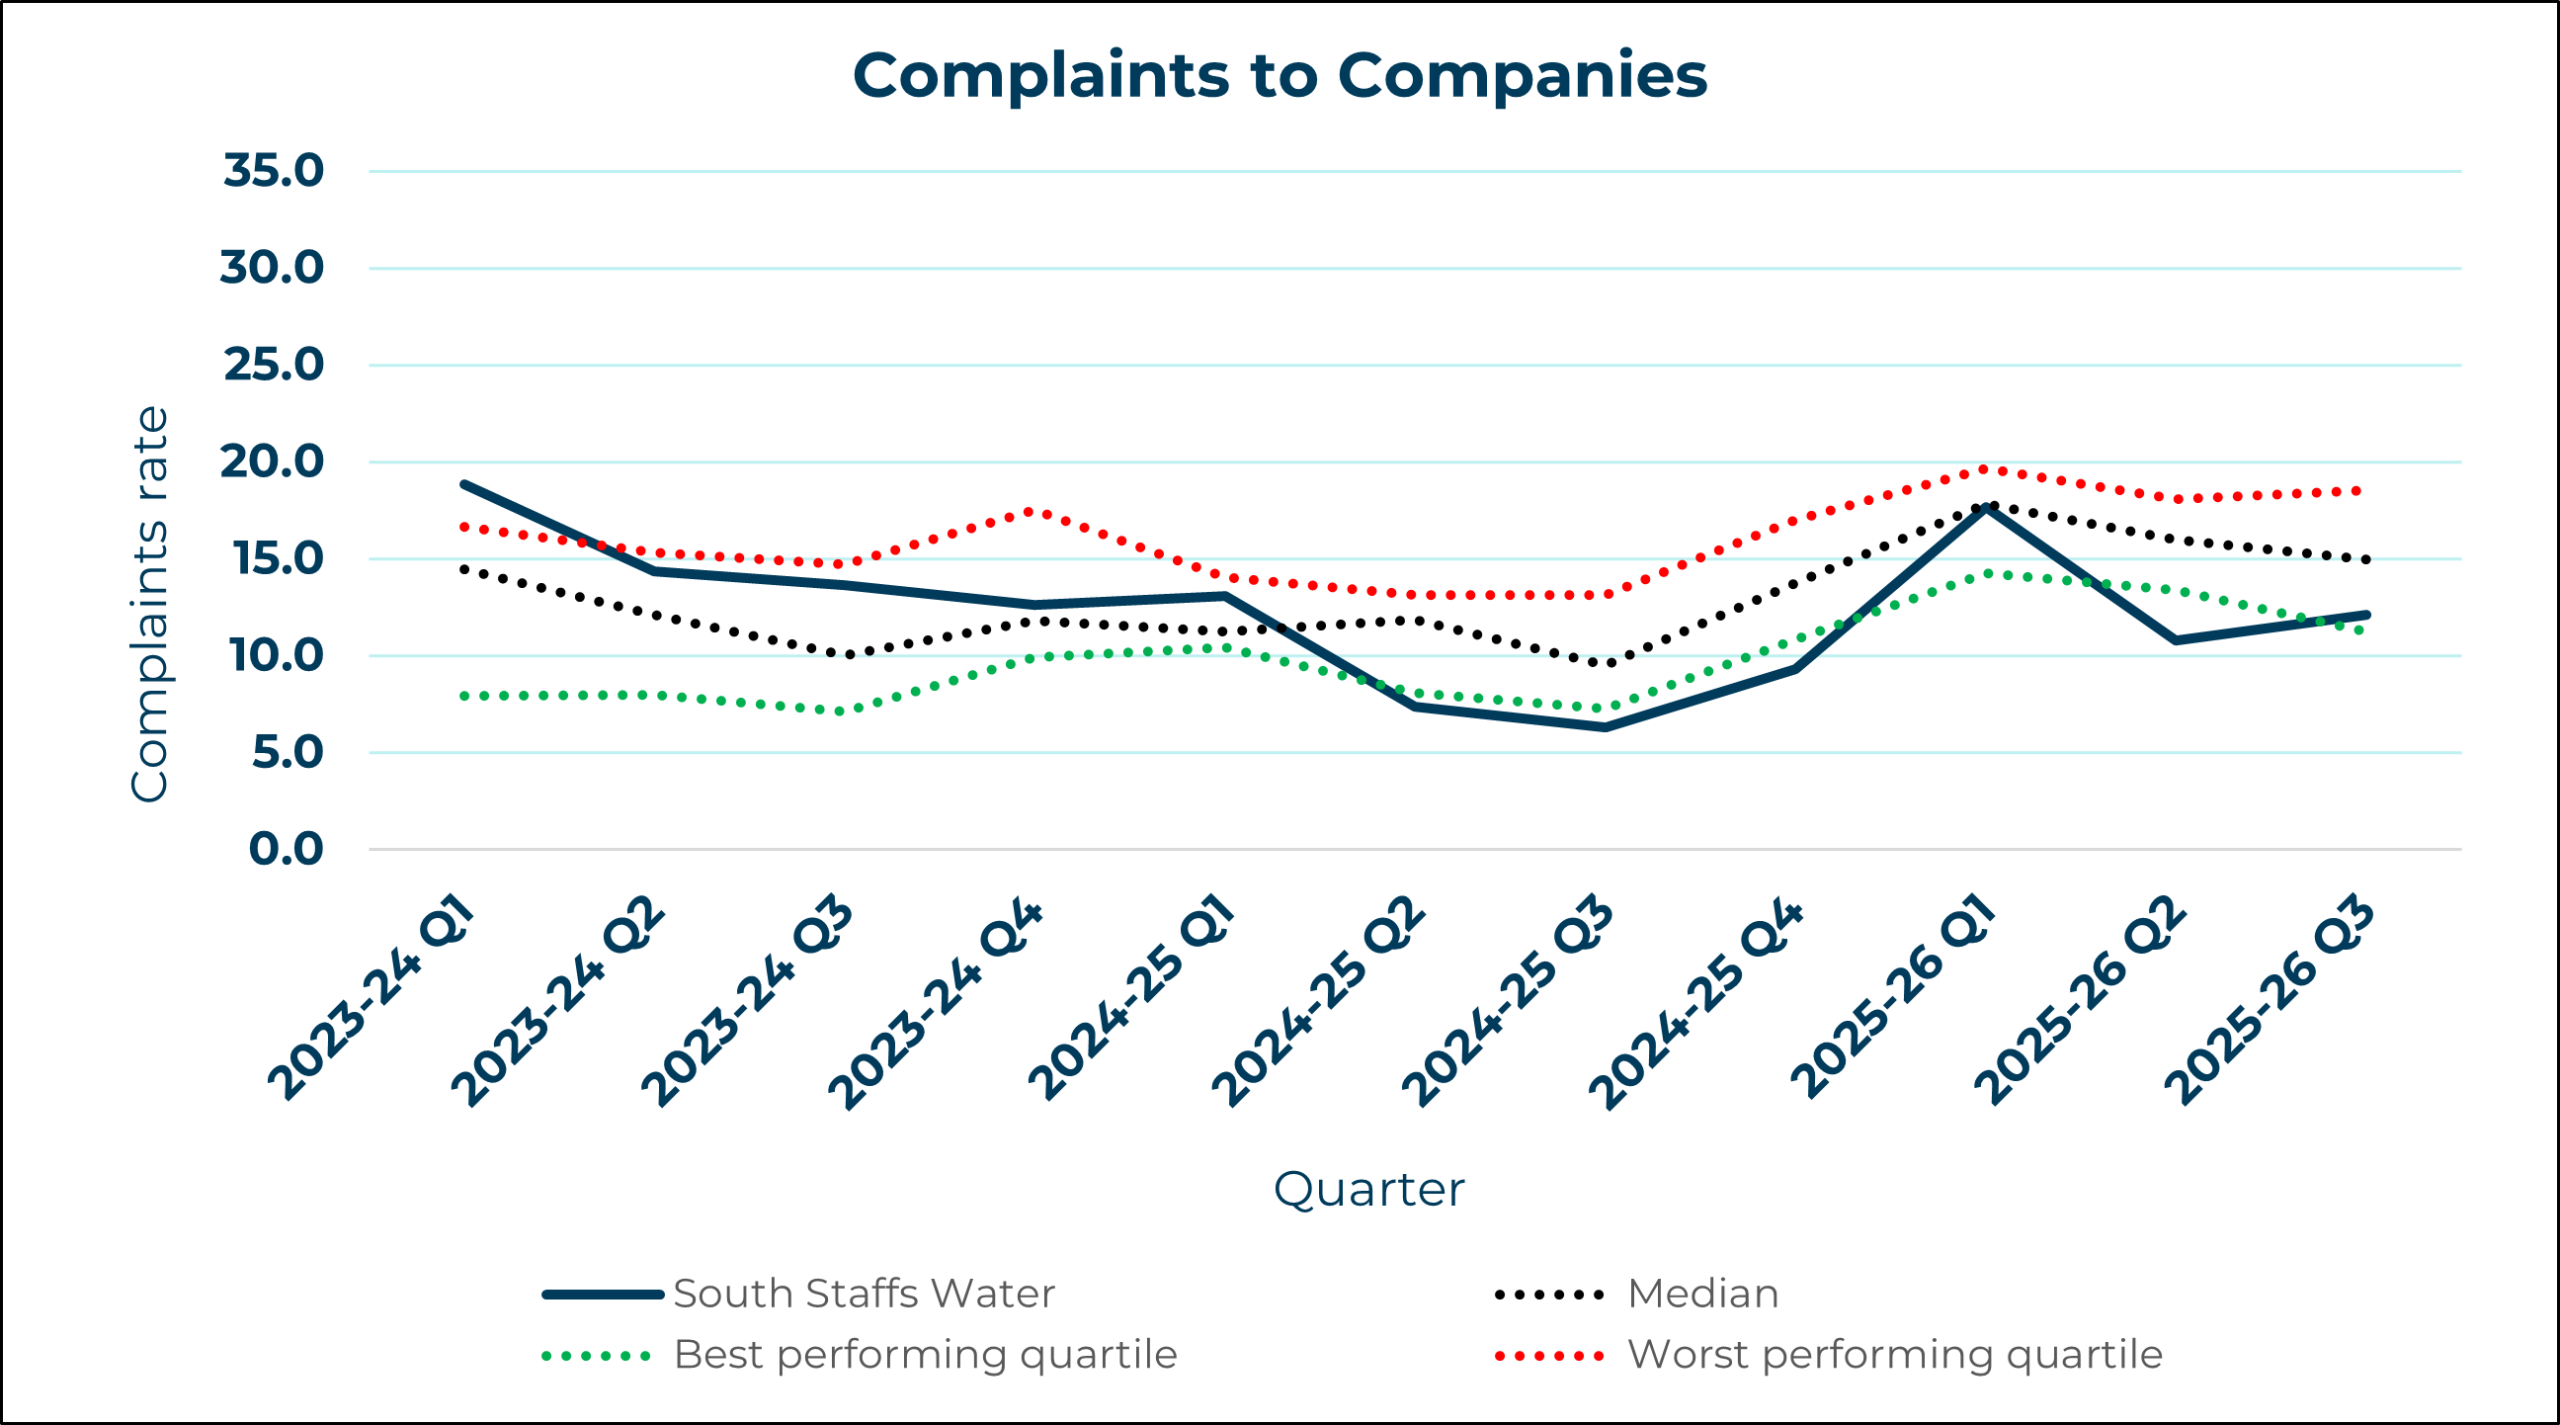
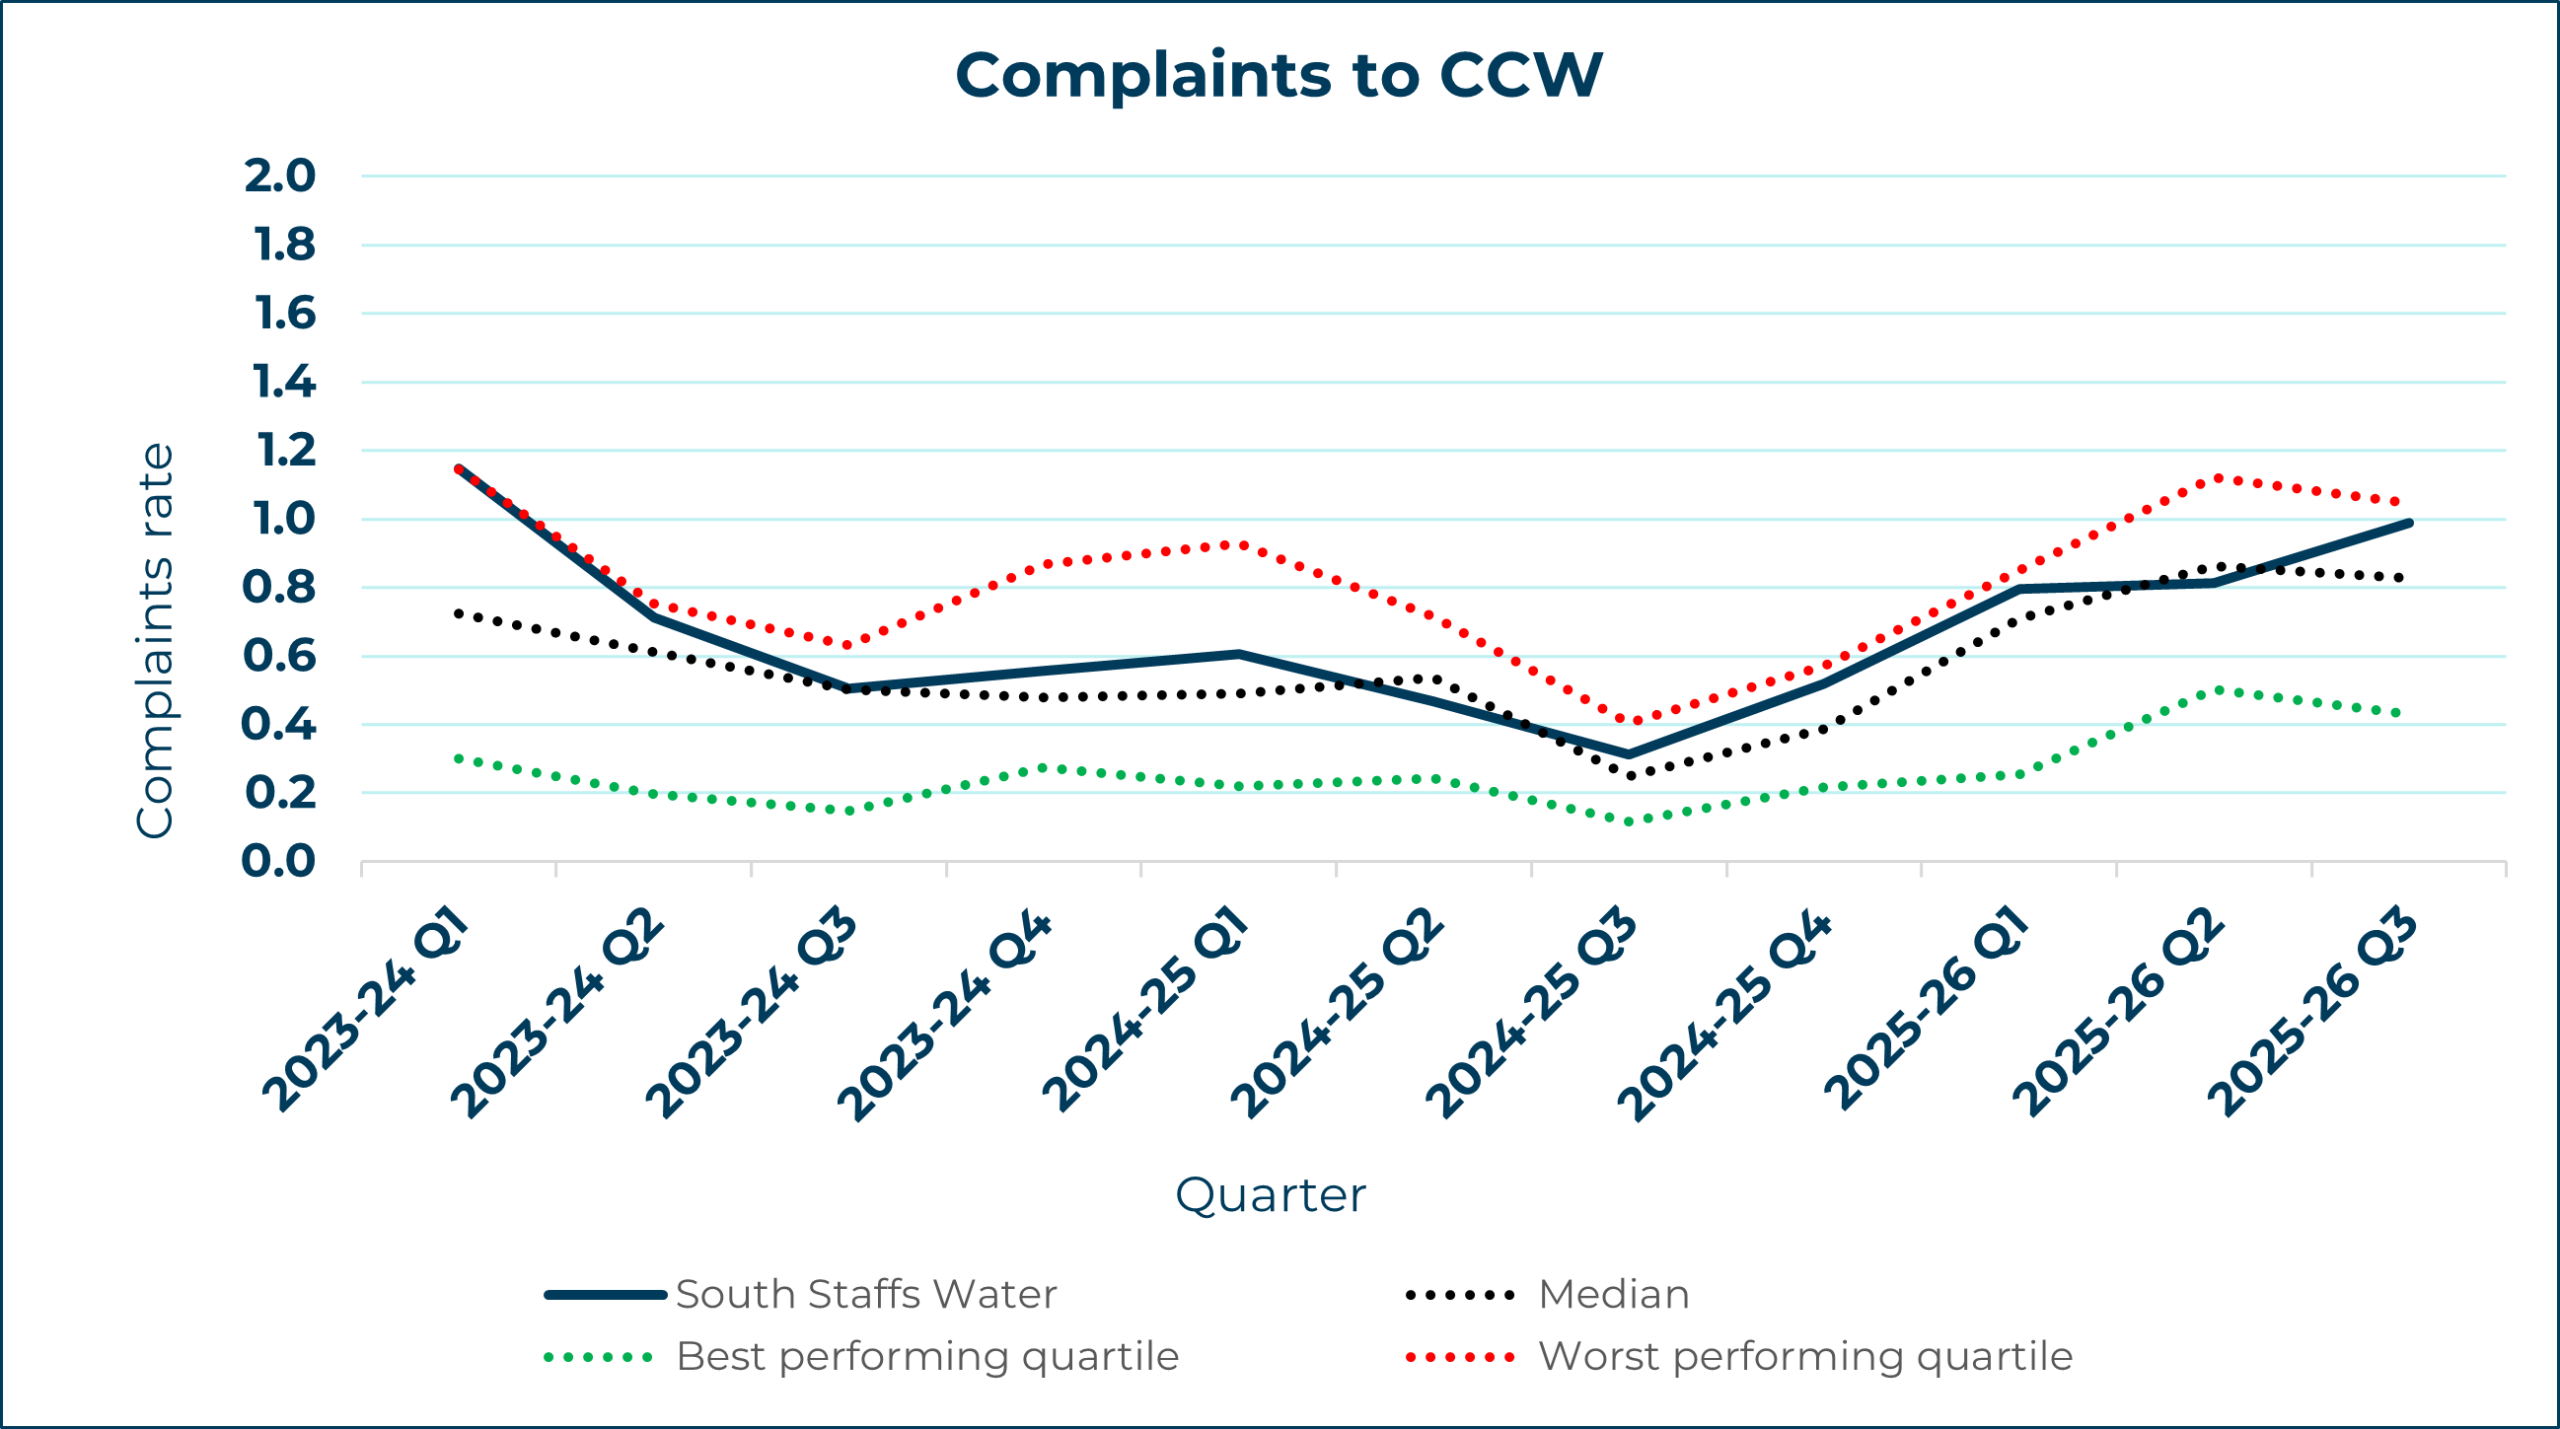
| South Staffs Water | 577,105 | 2,340 | 40.55 | 150 | 2.60 |
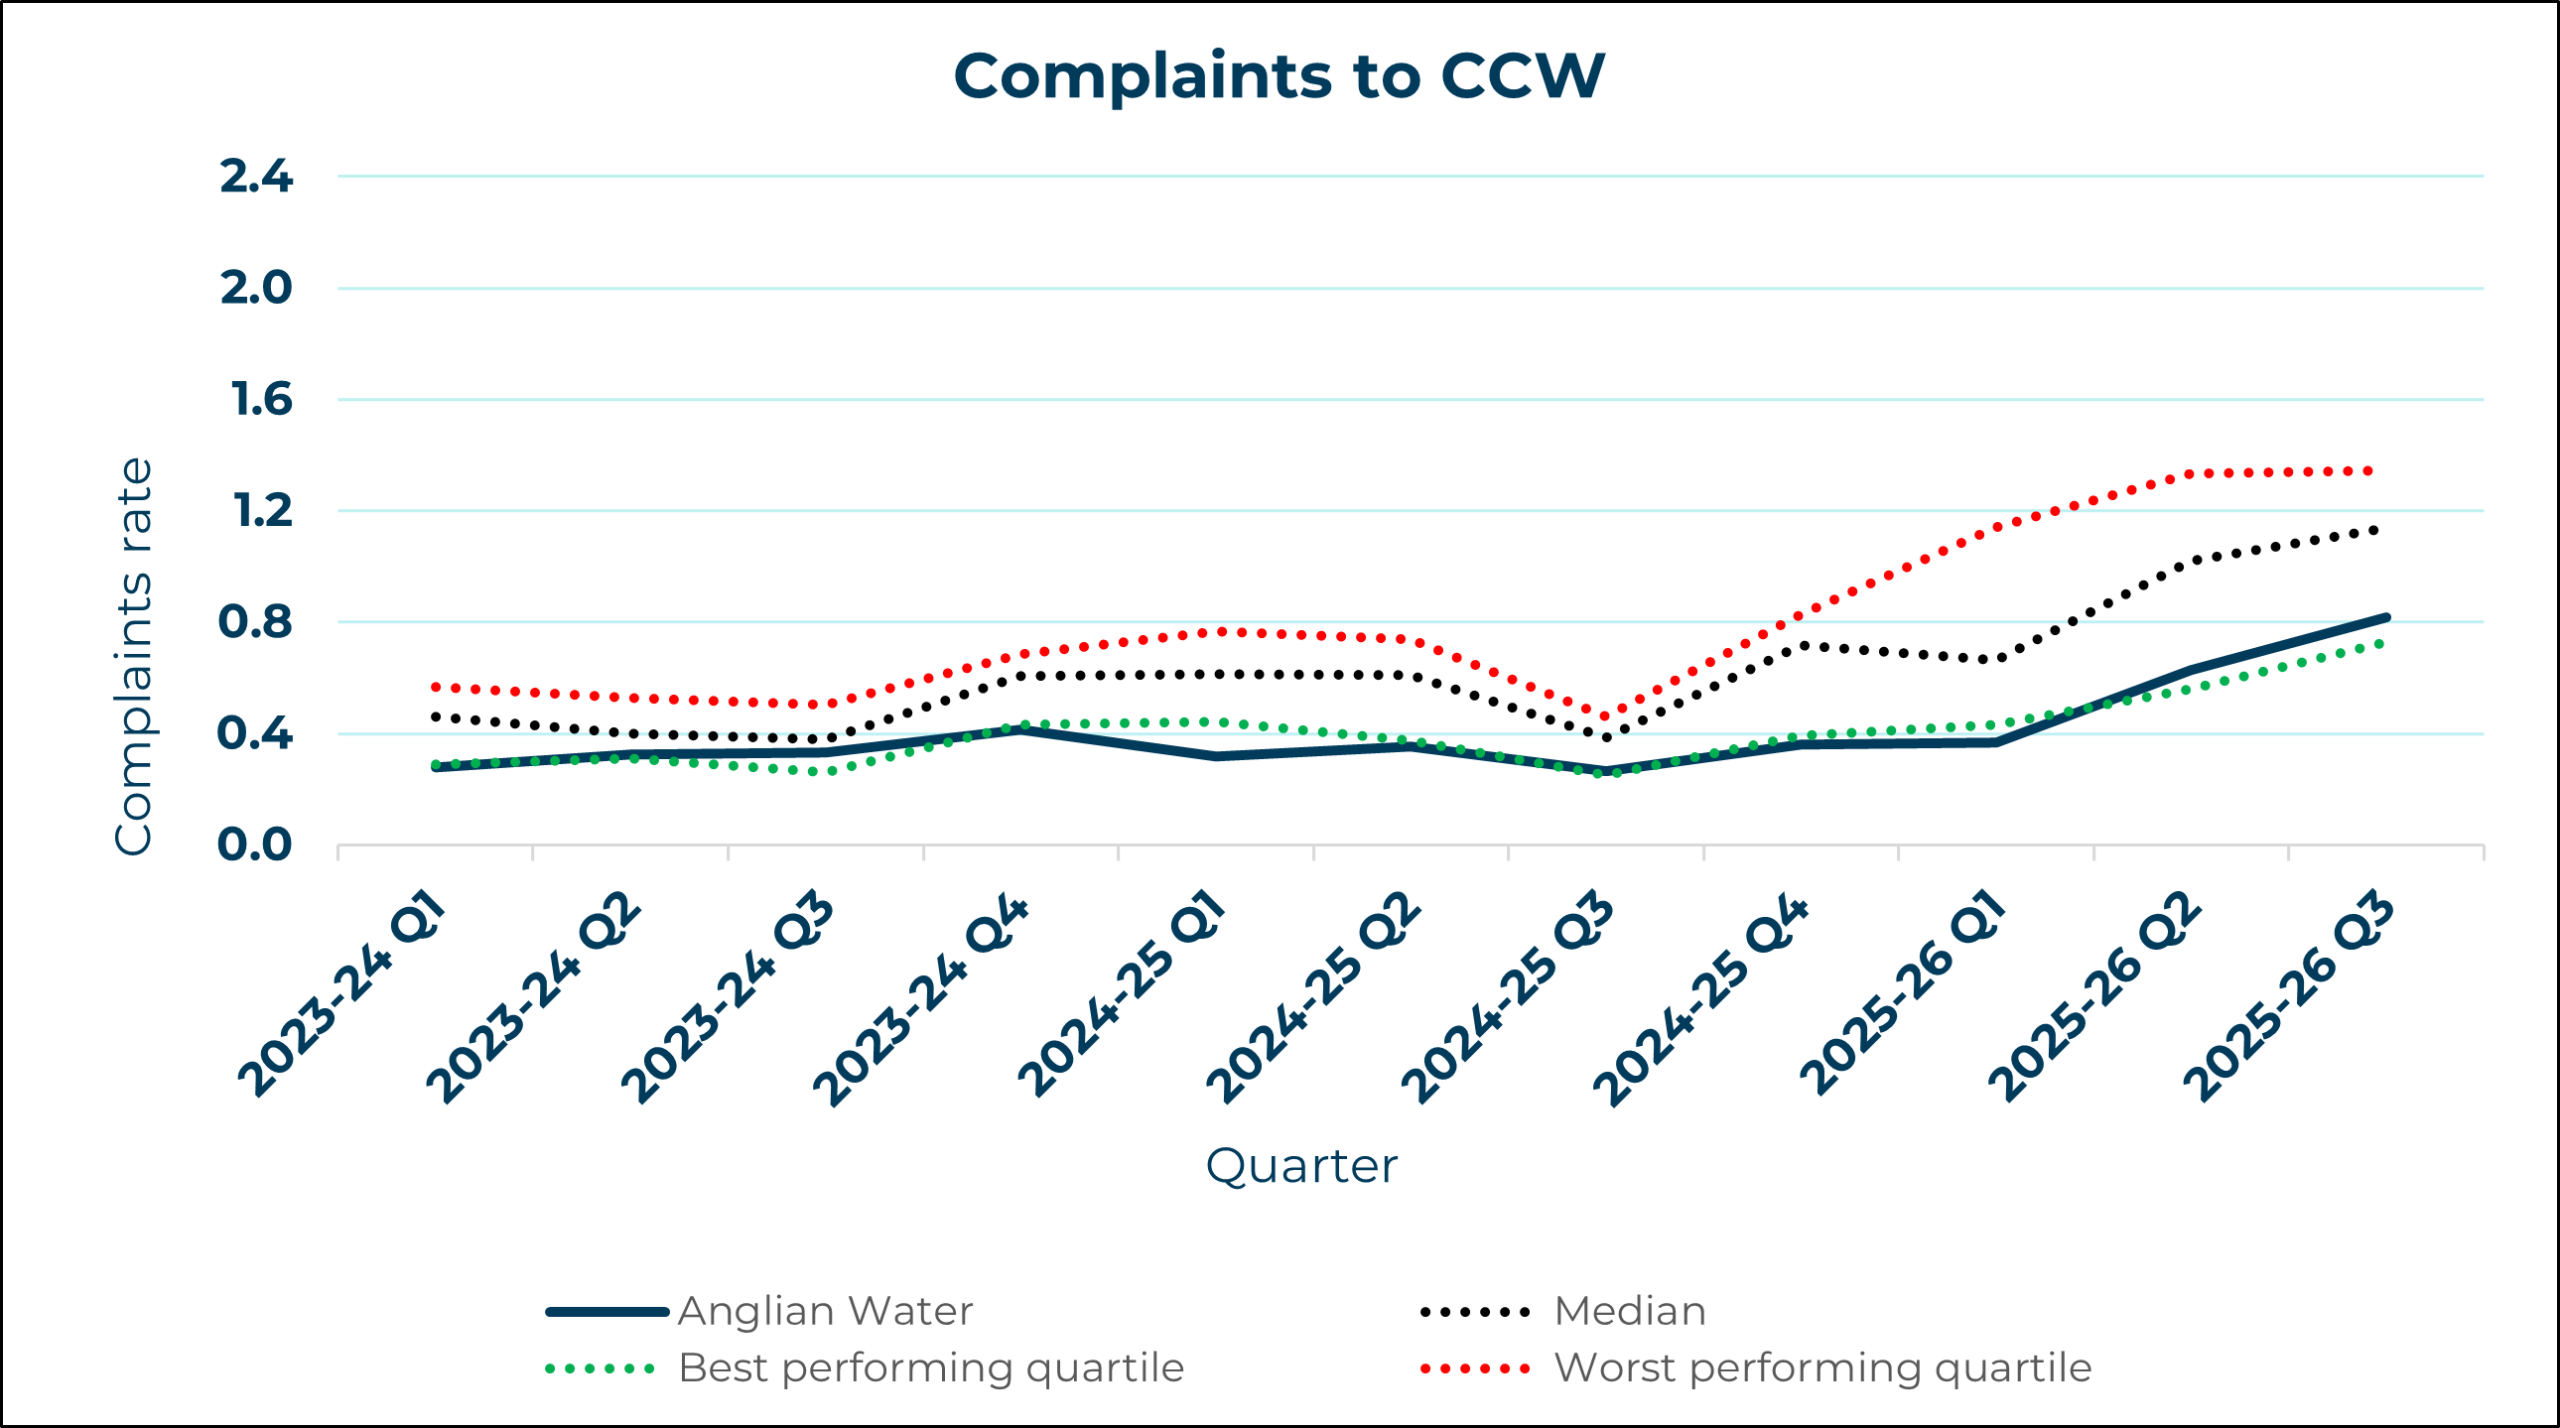
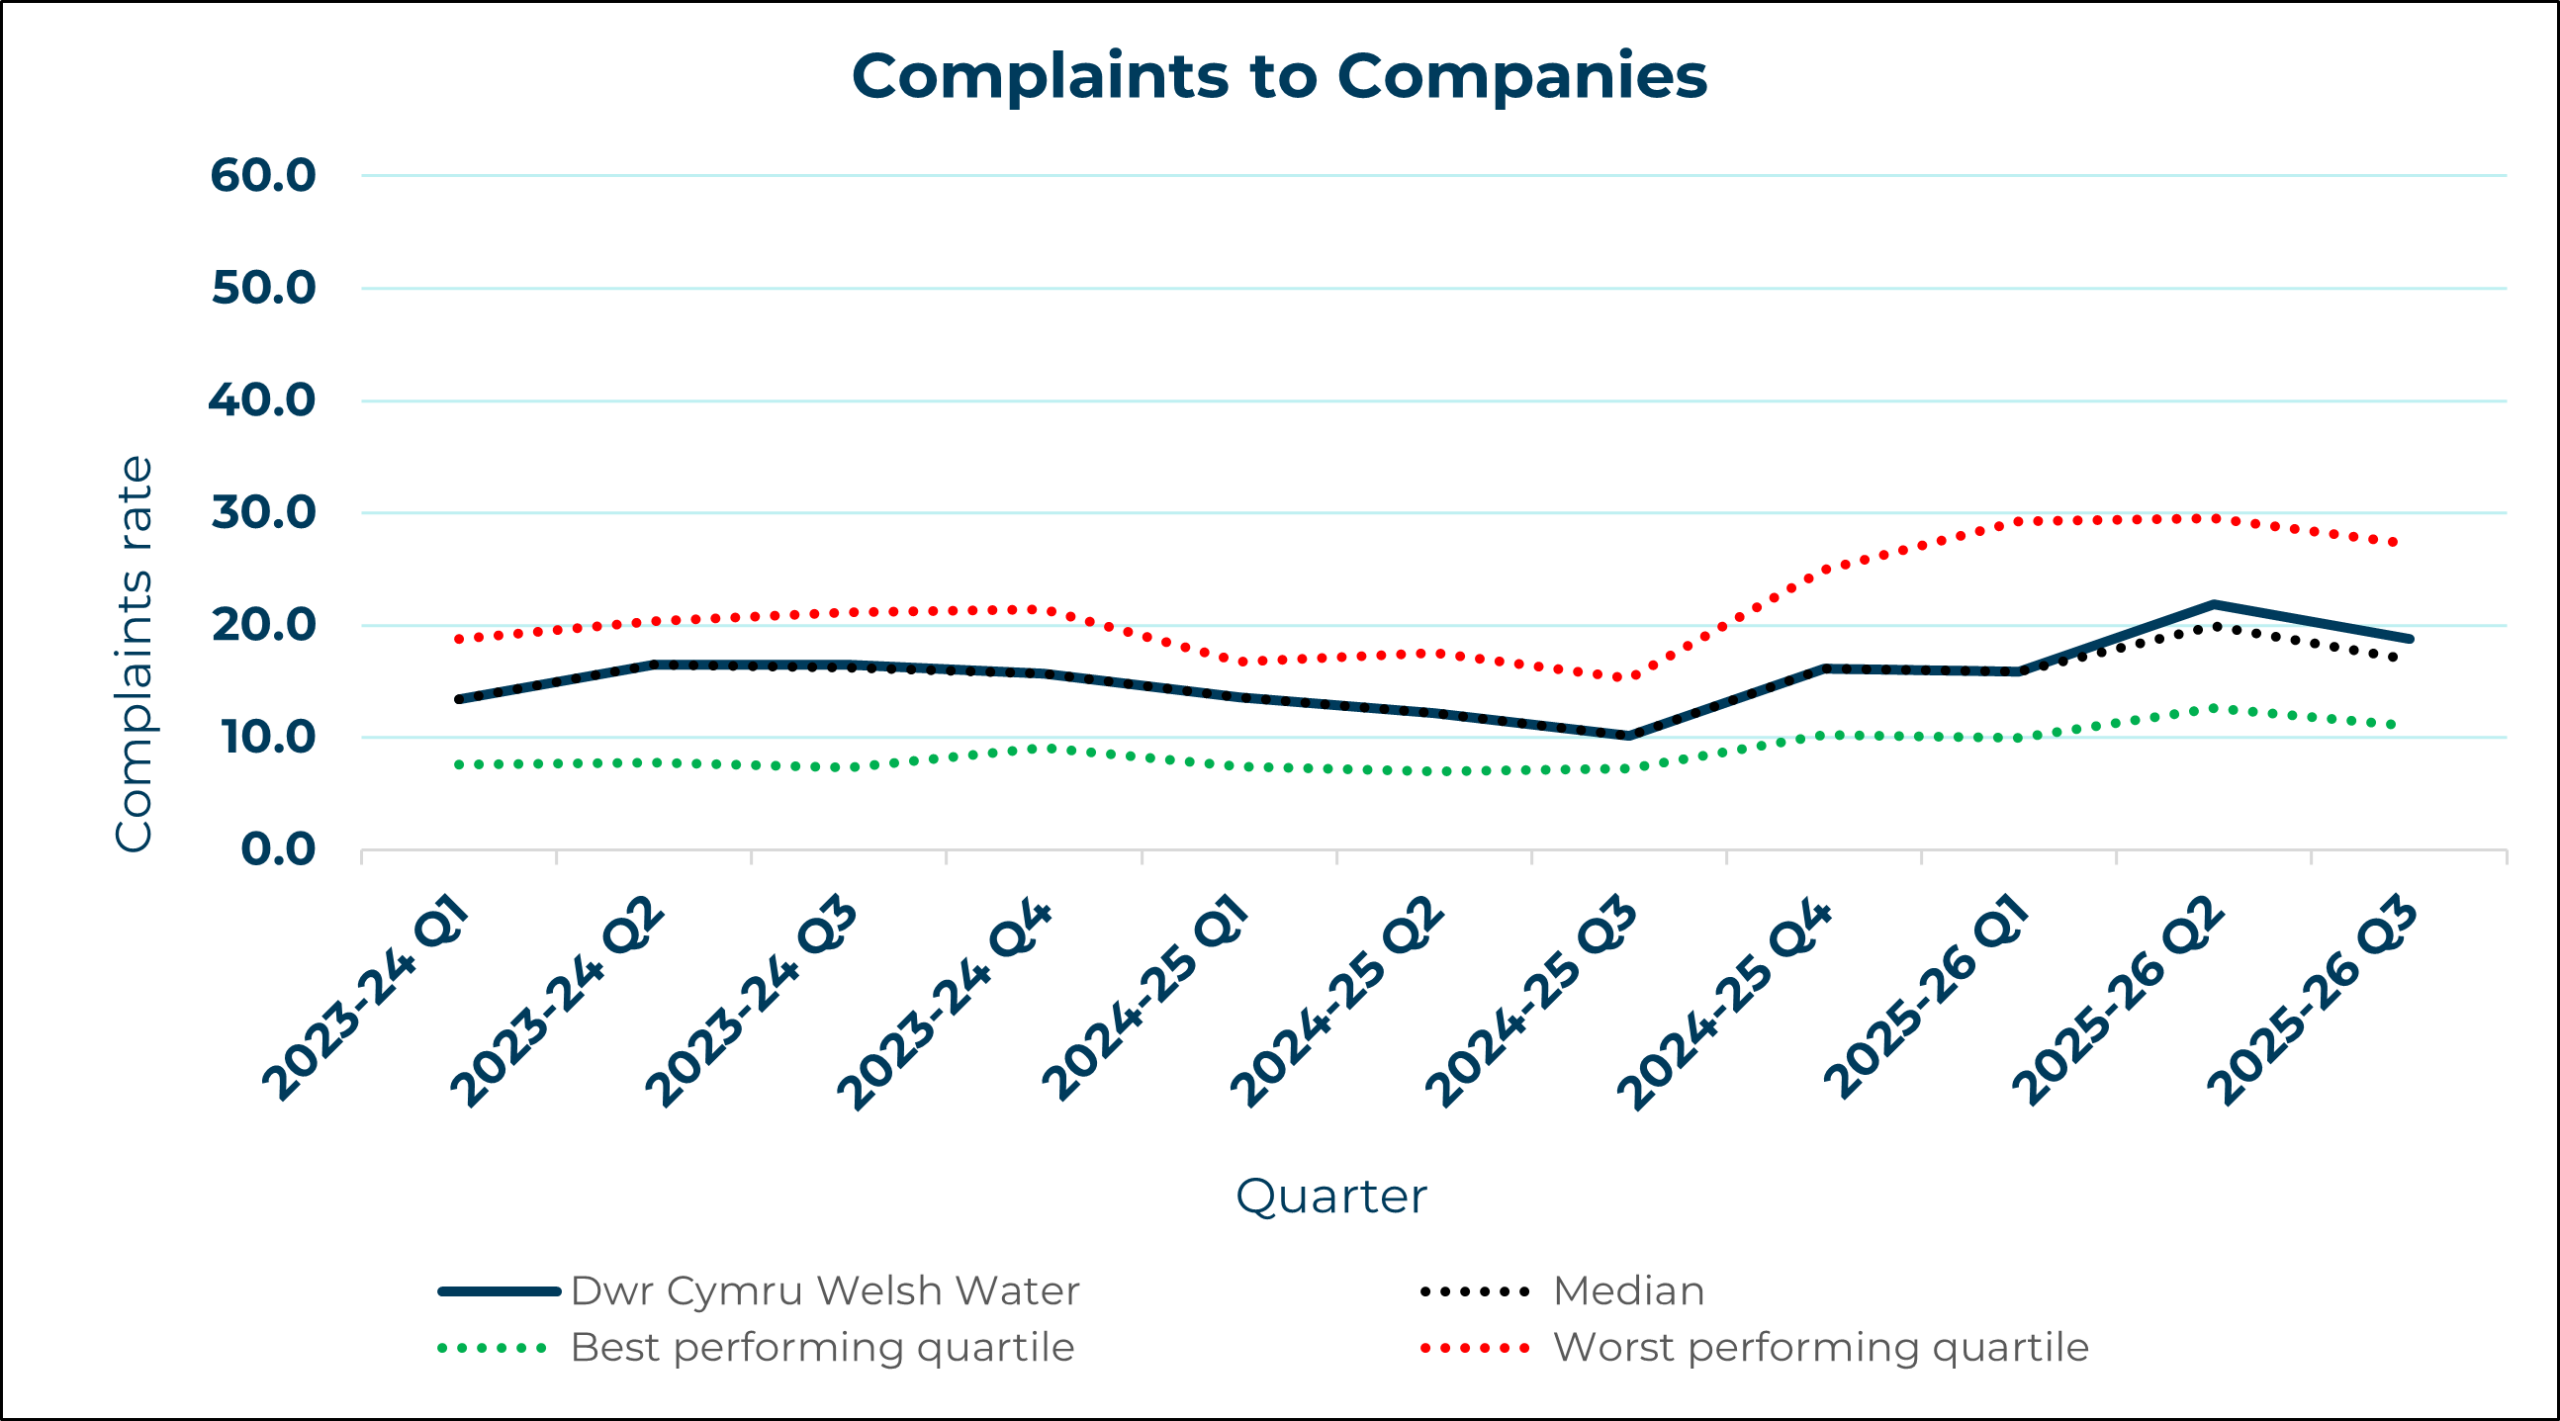
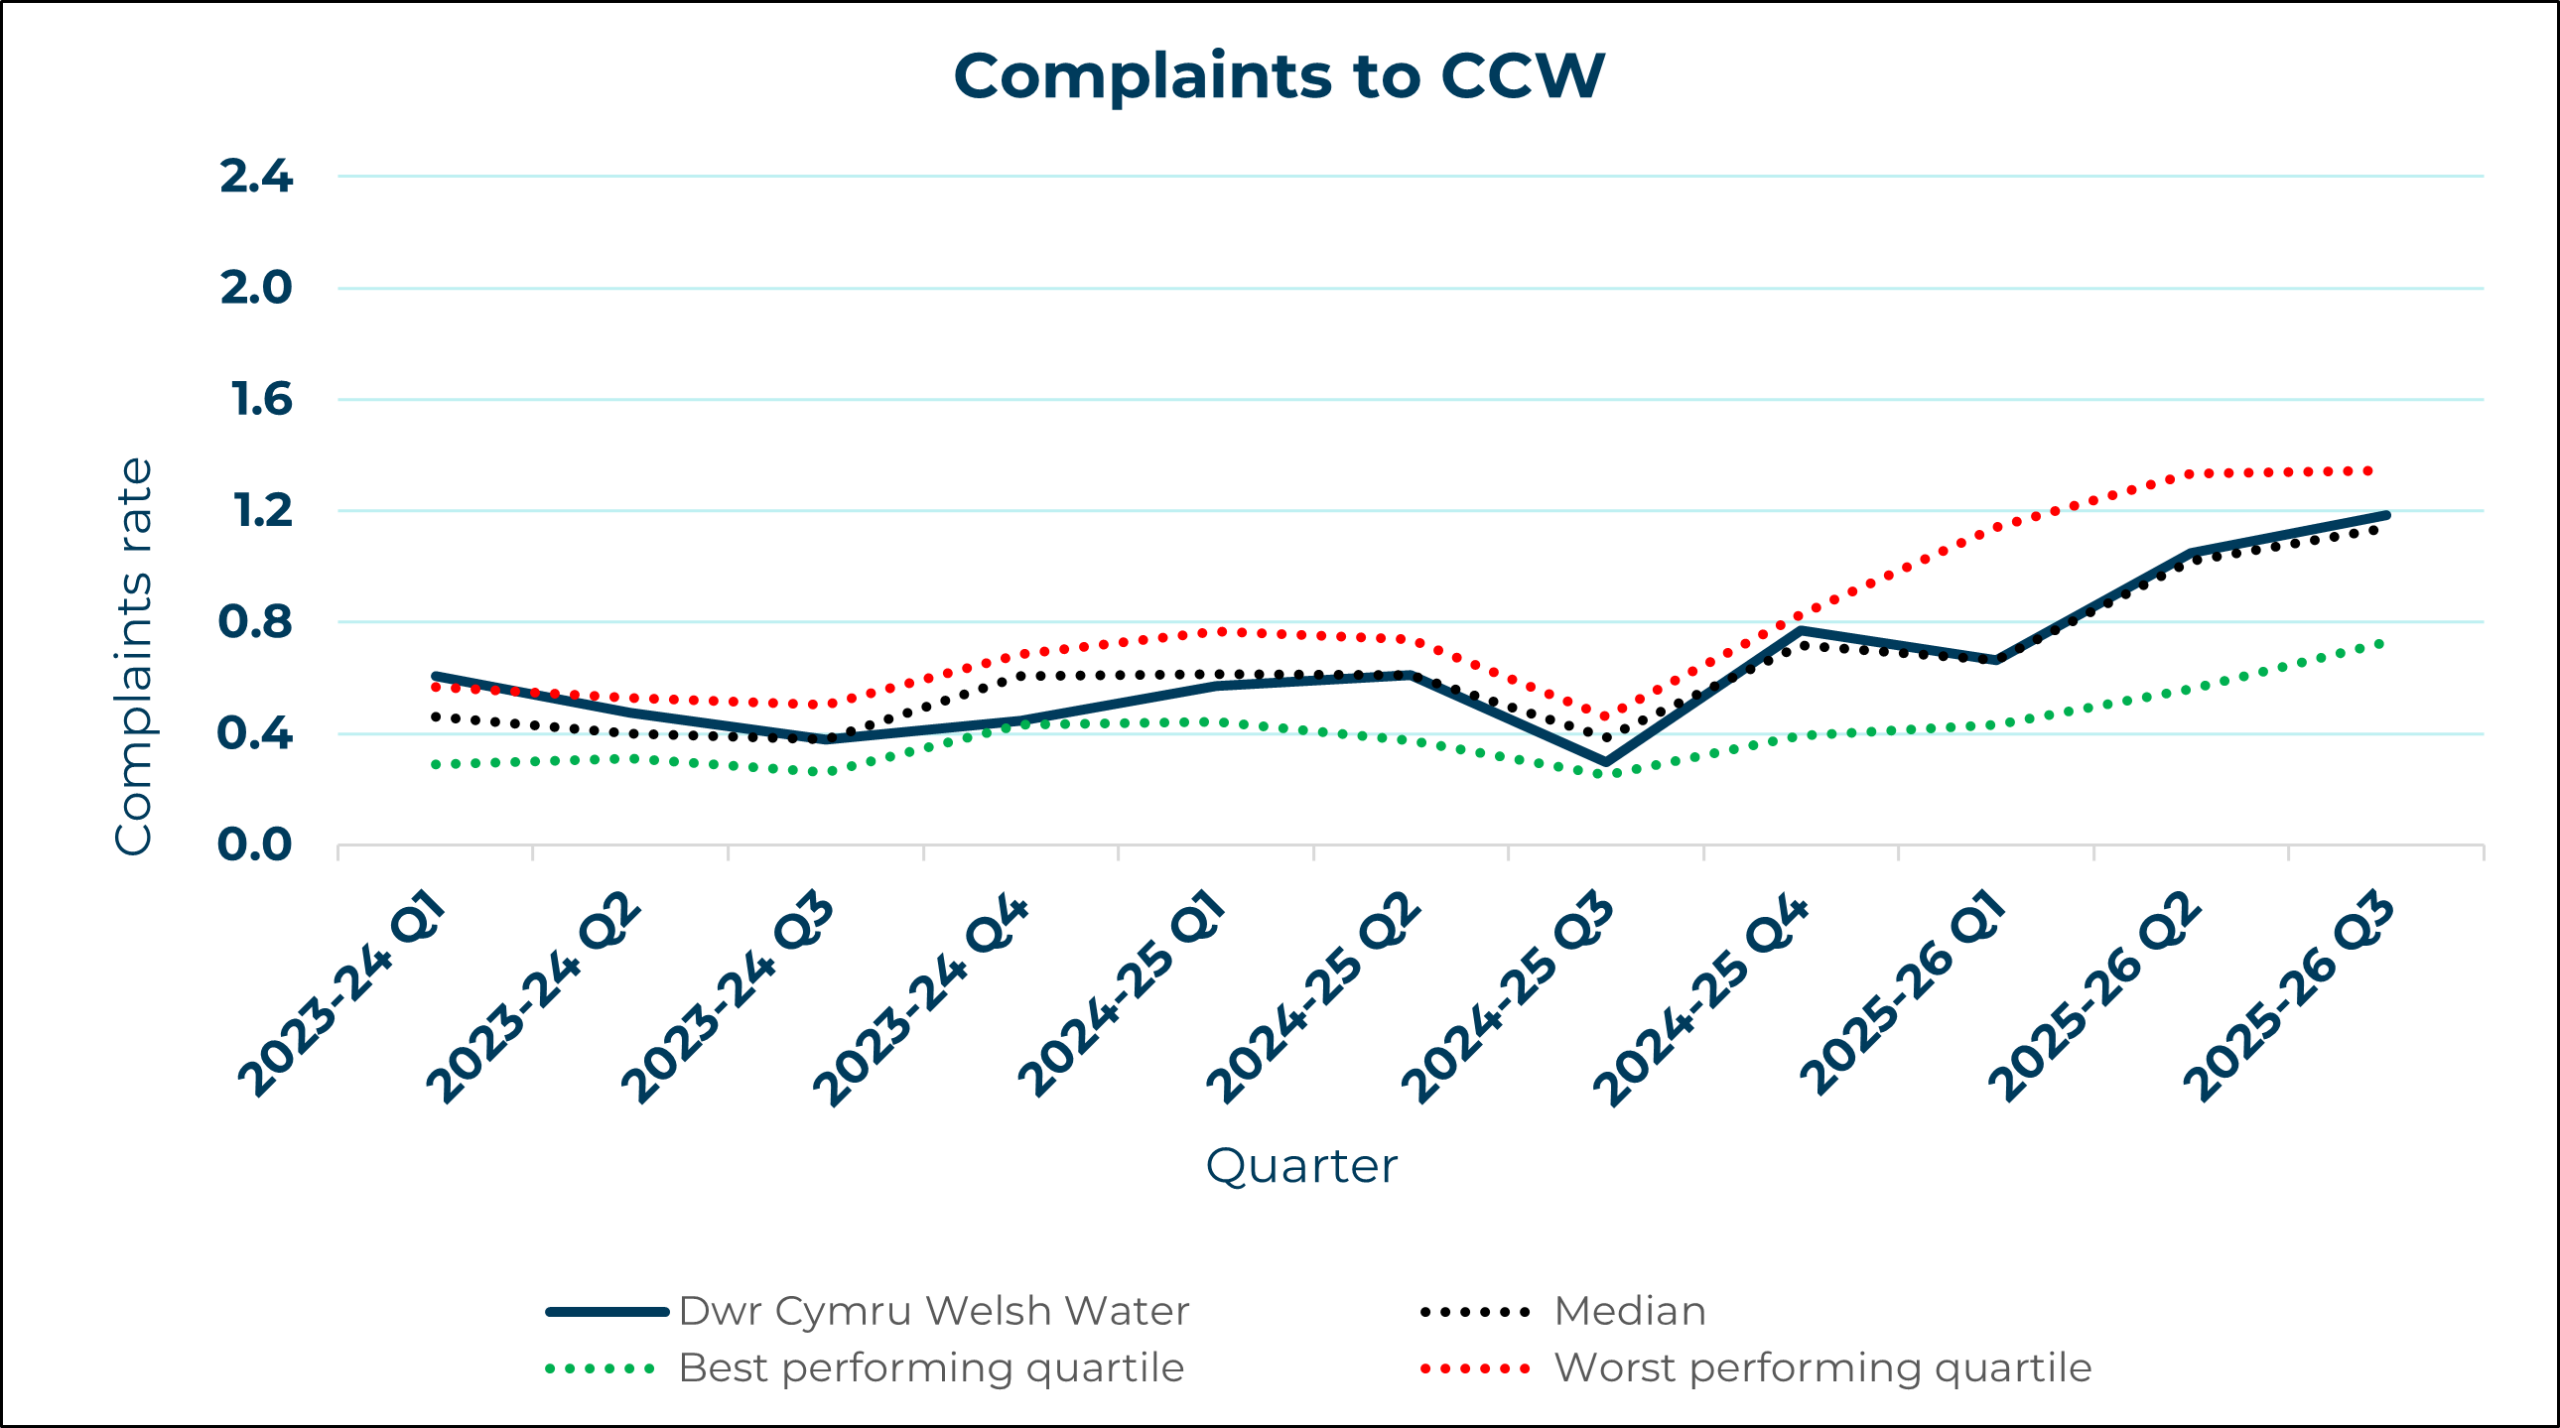
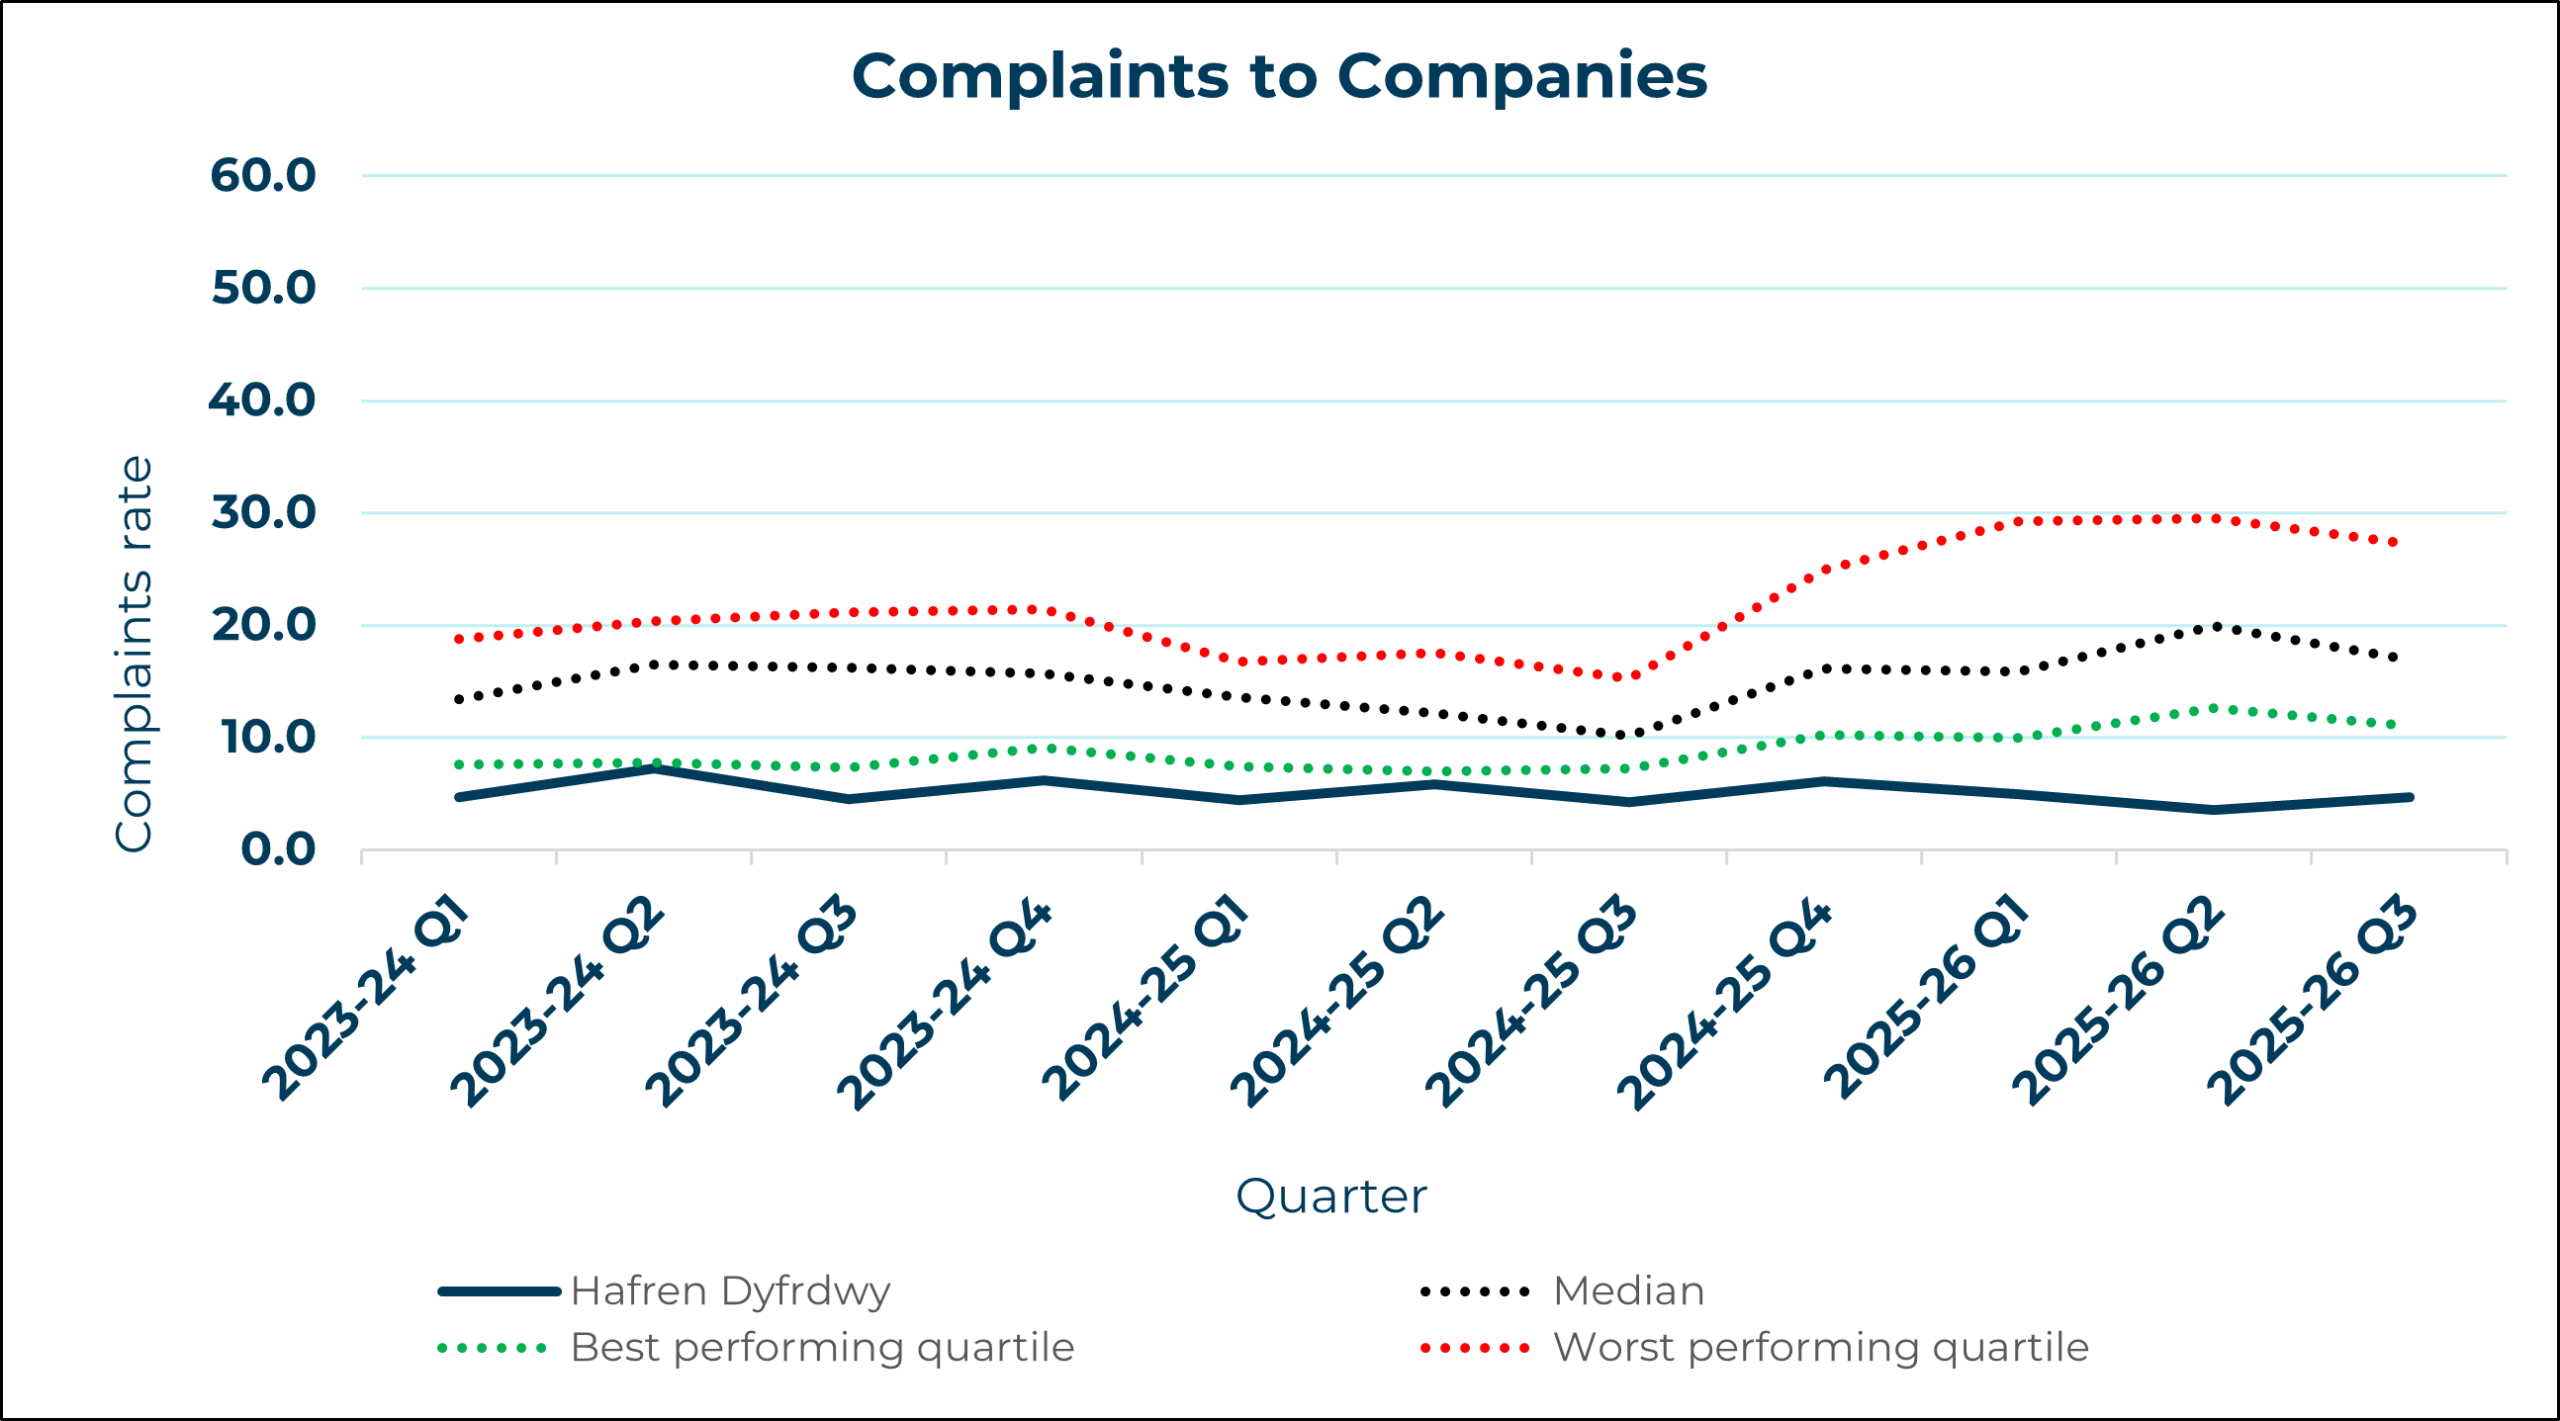
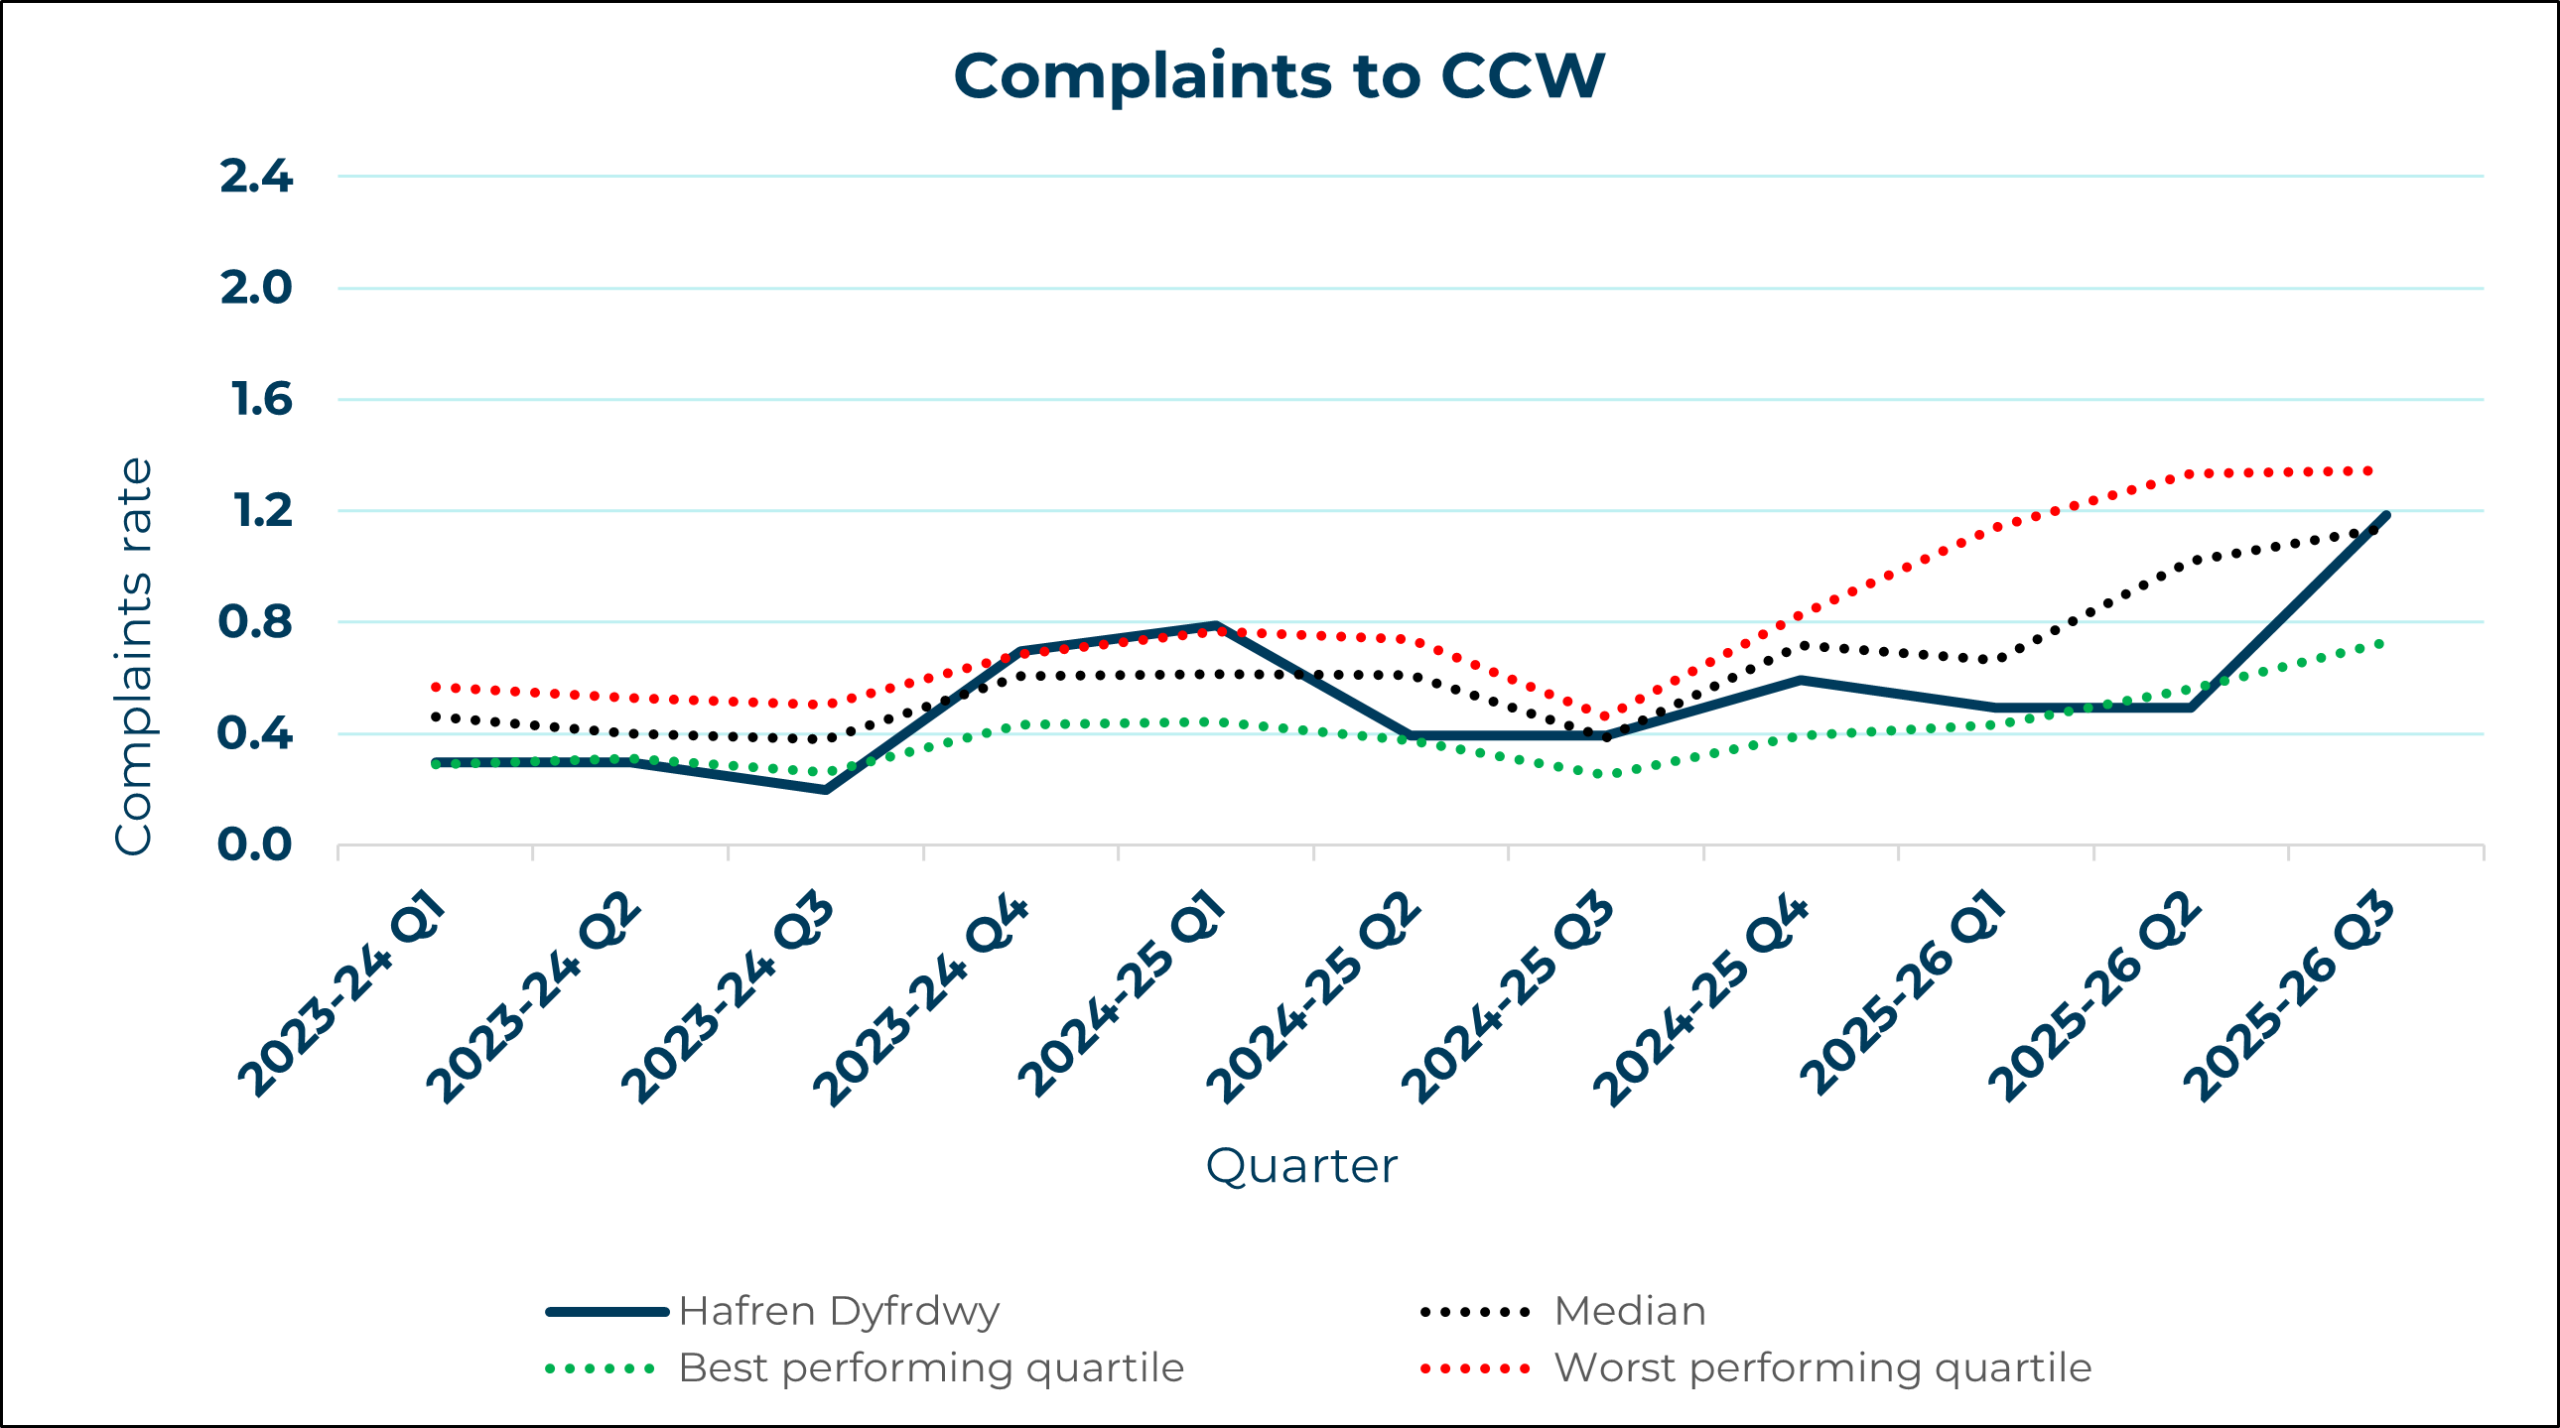
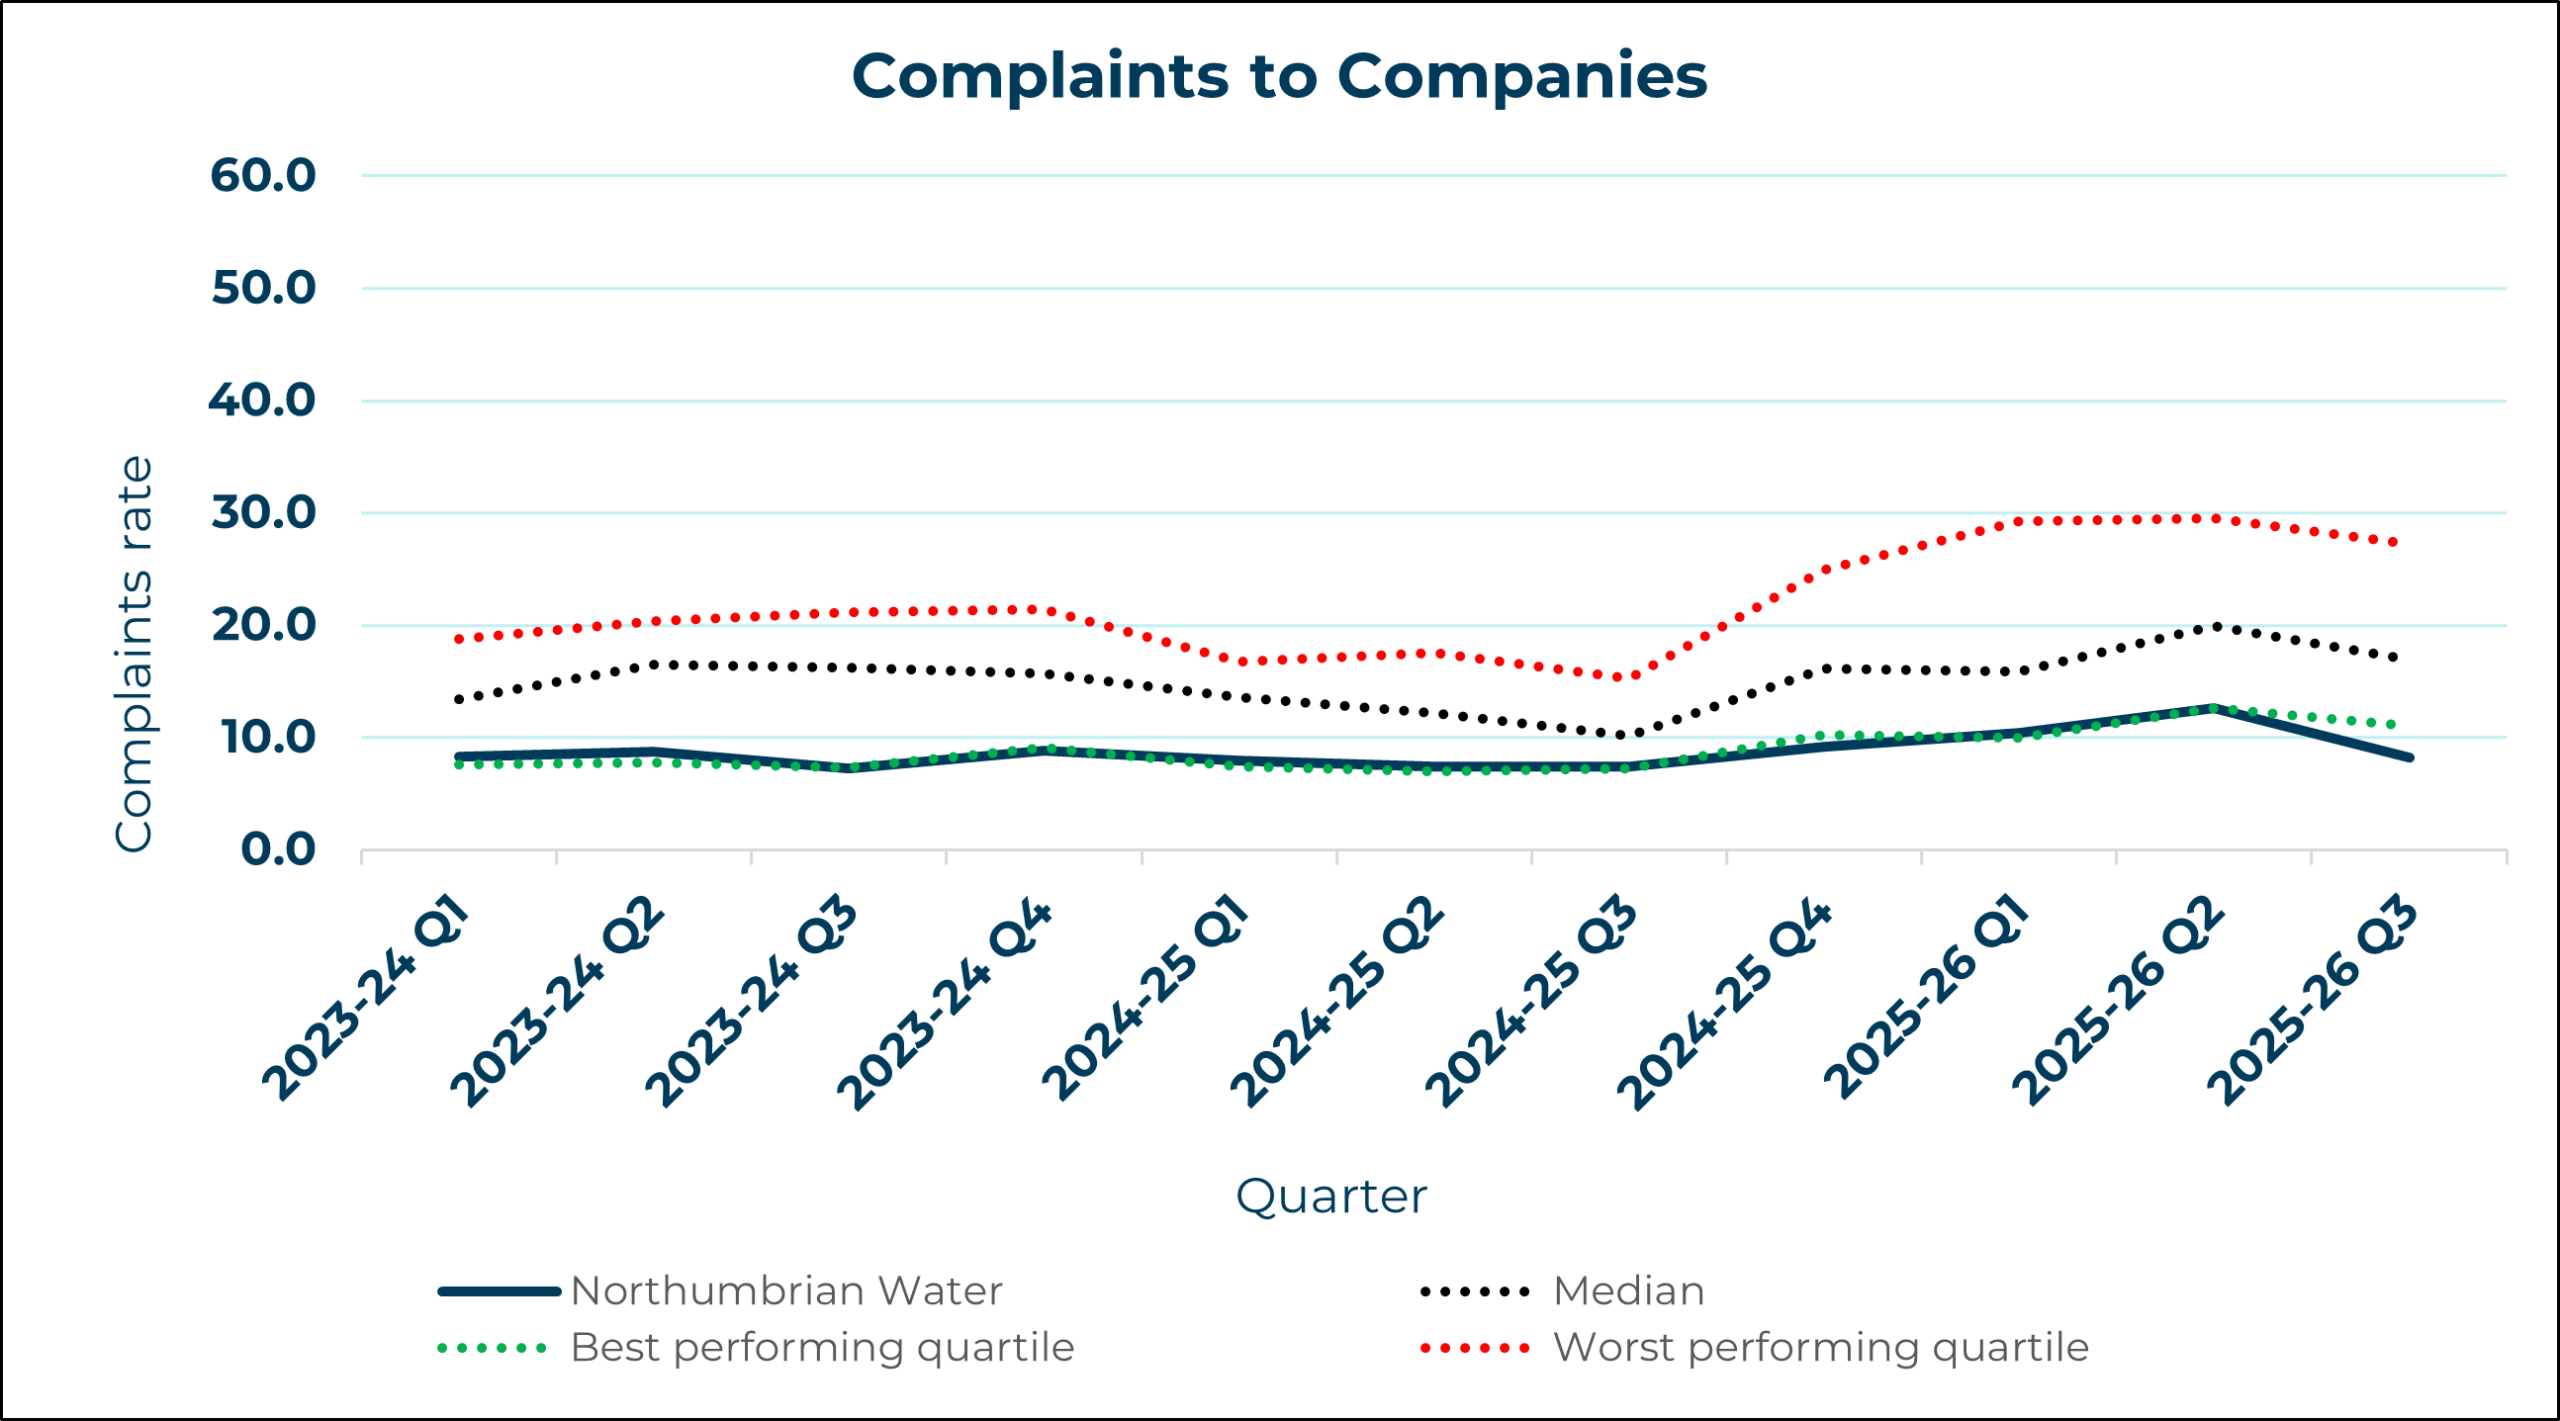
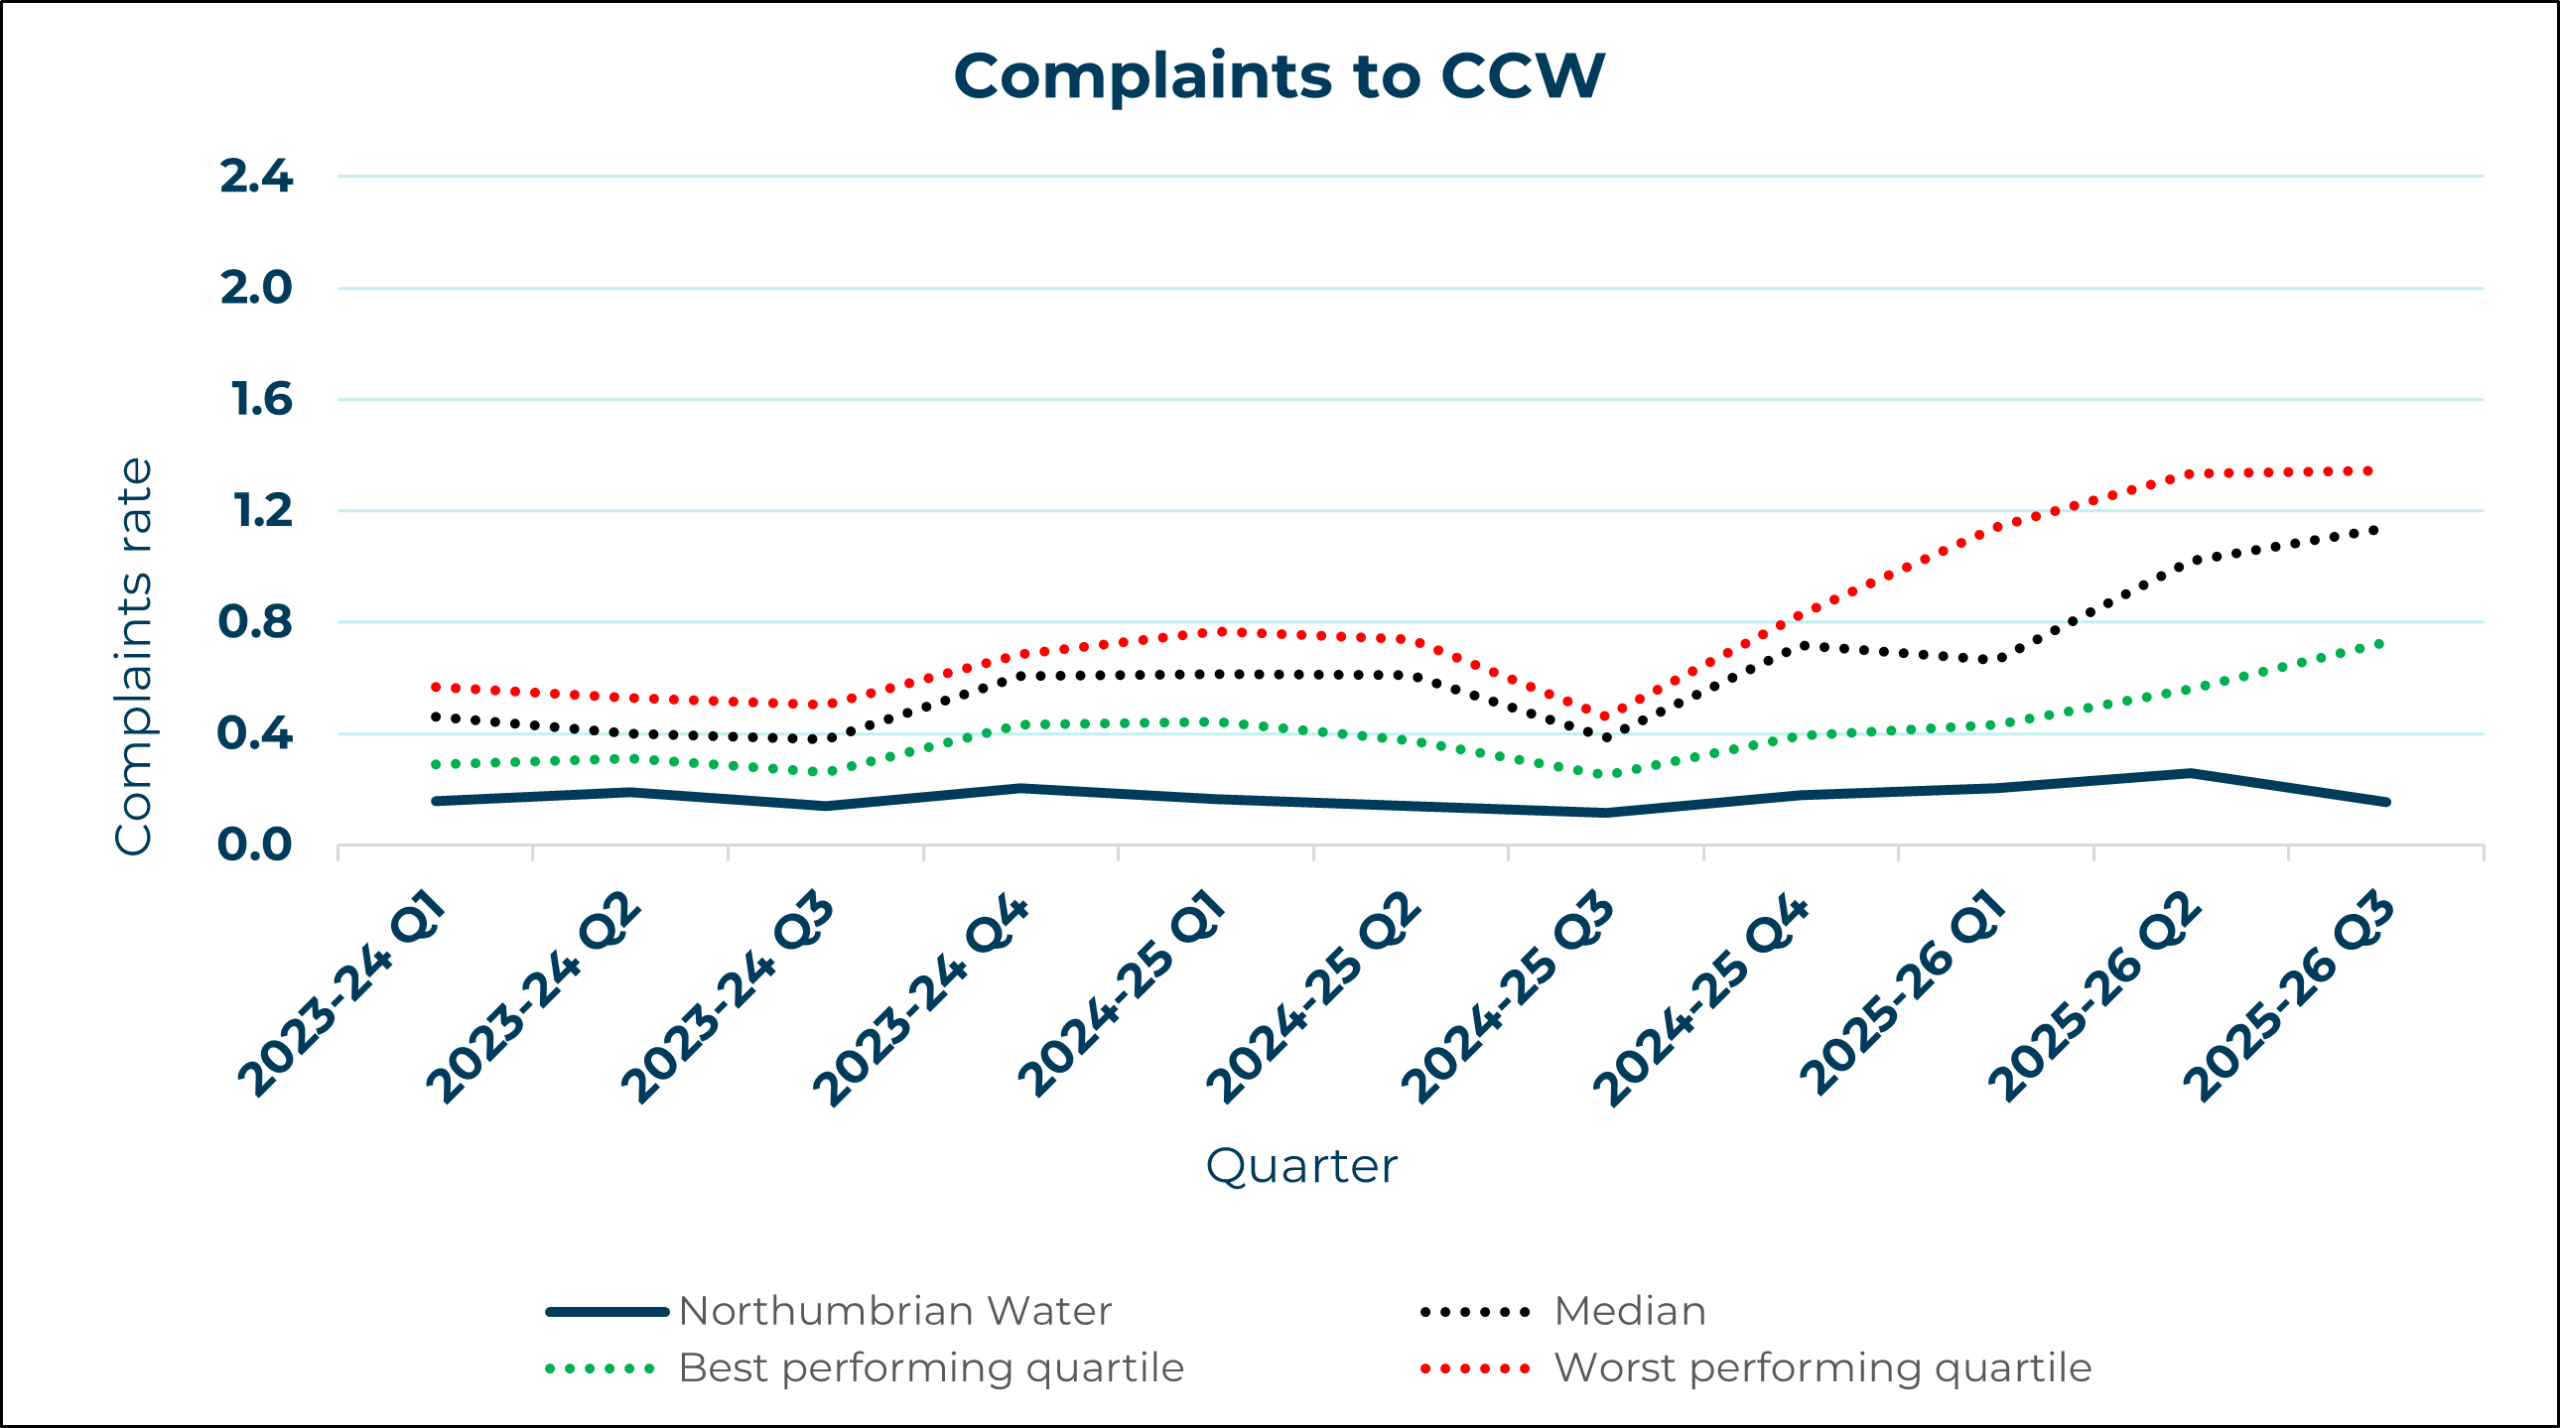
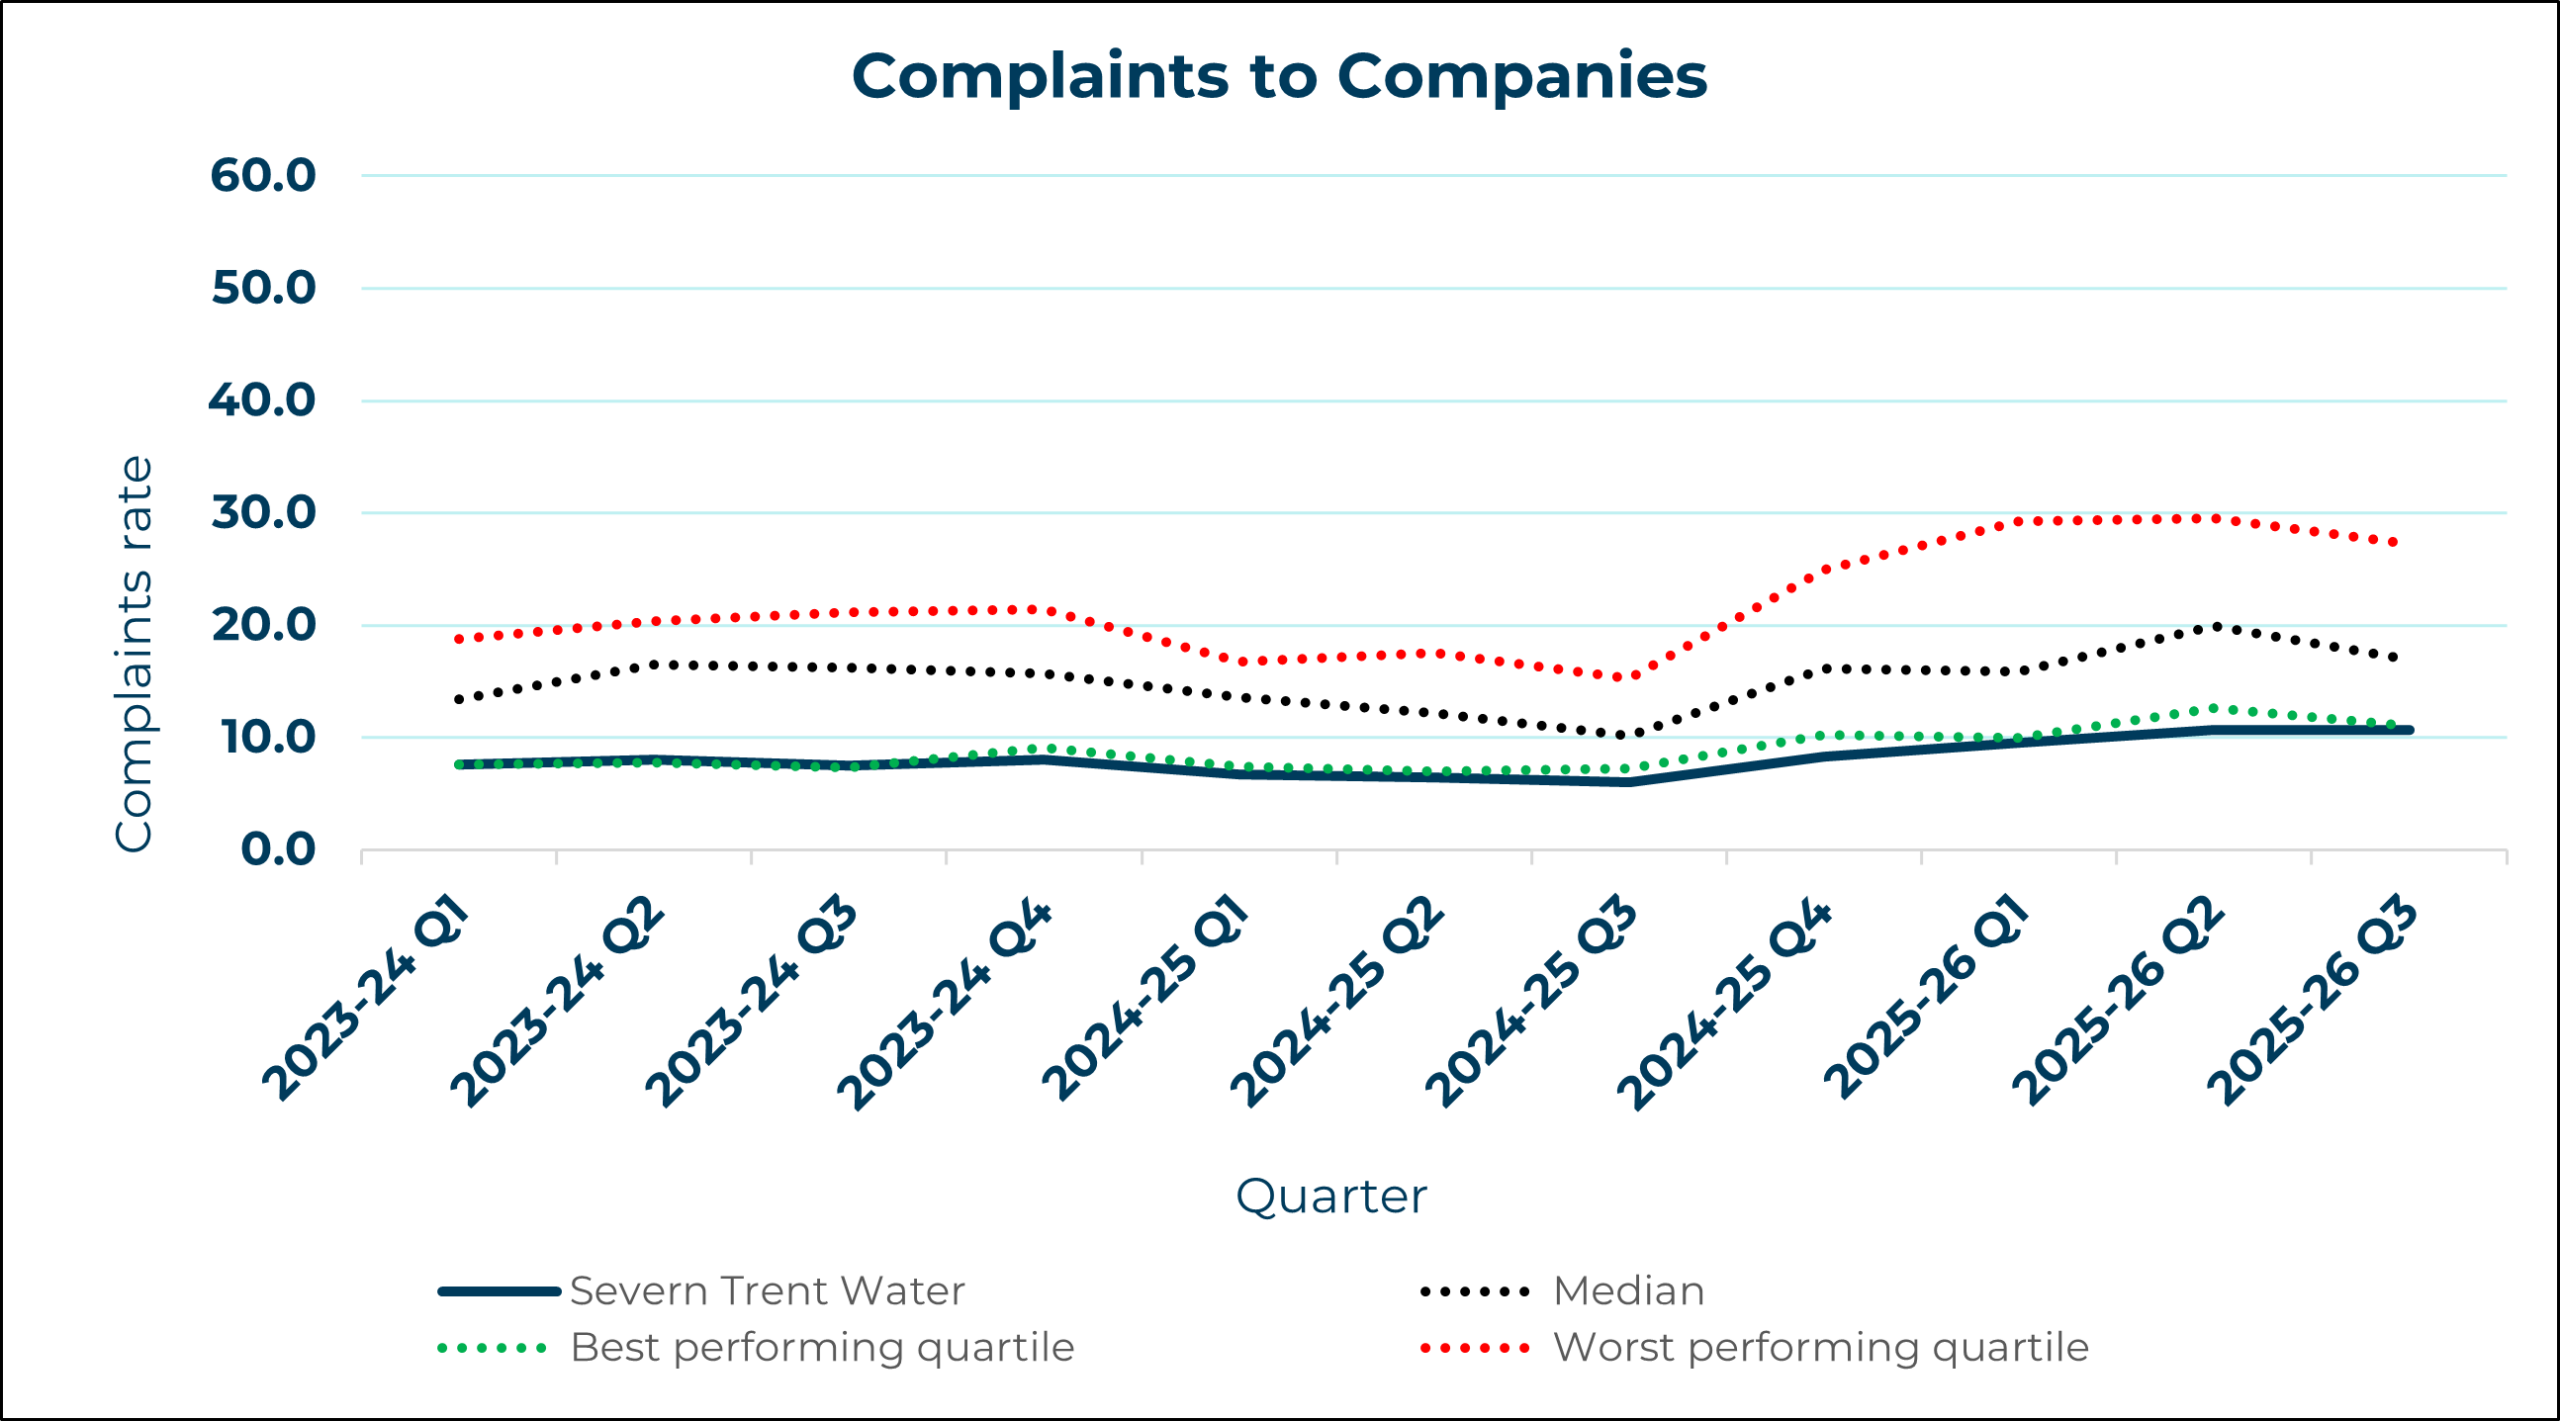
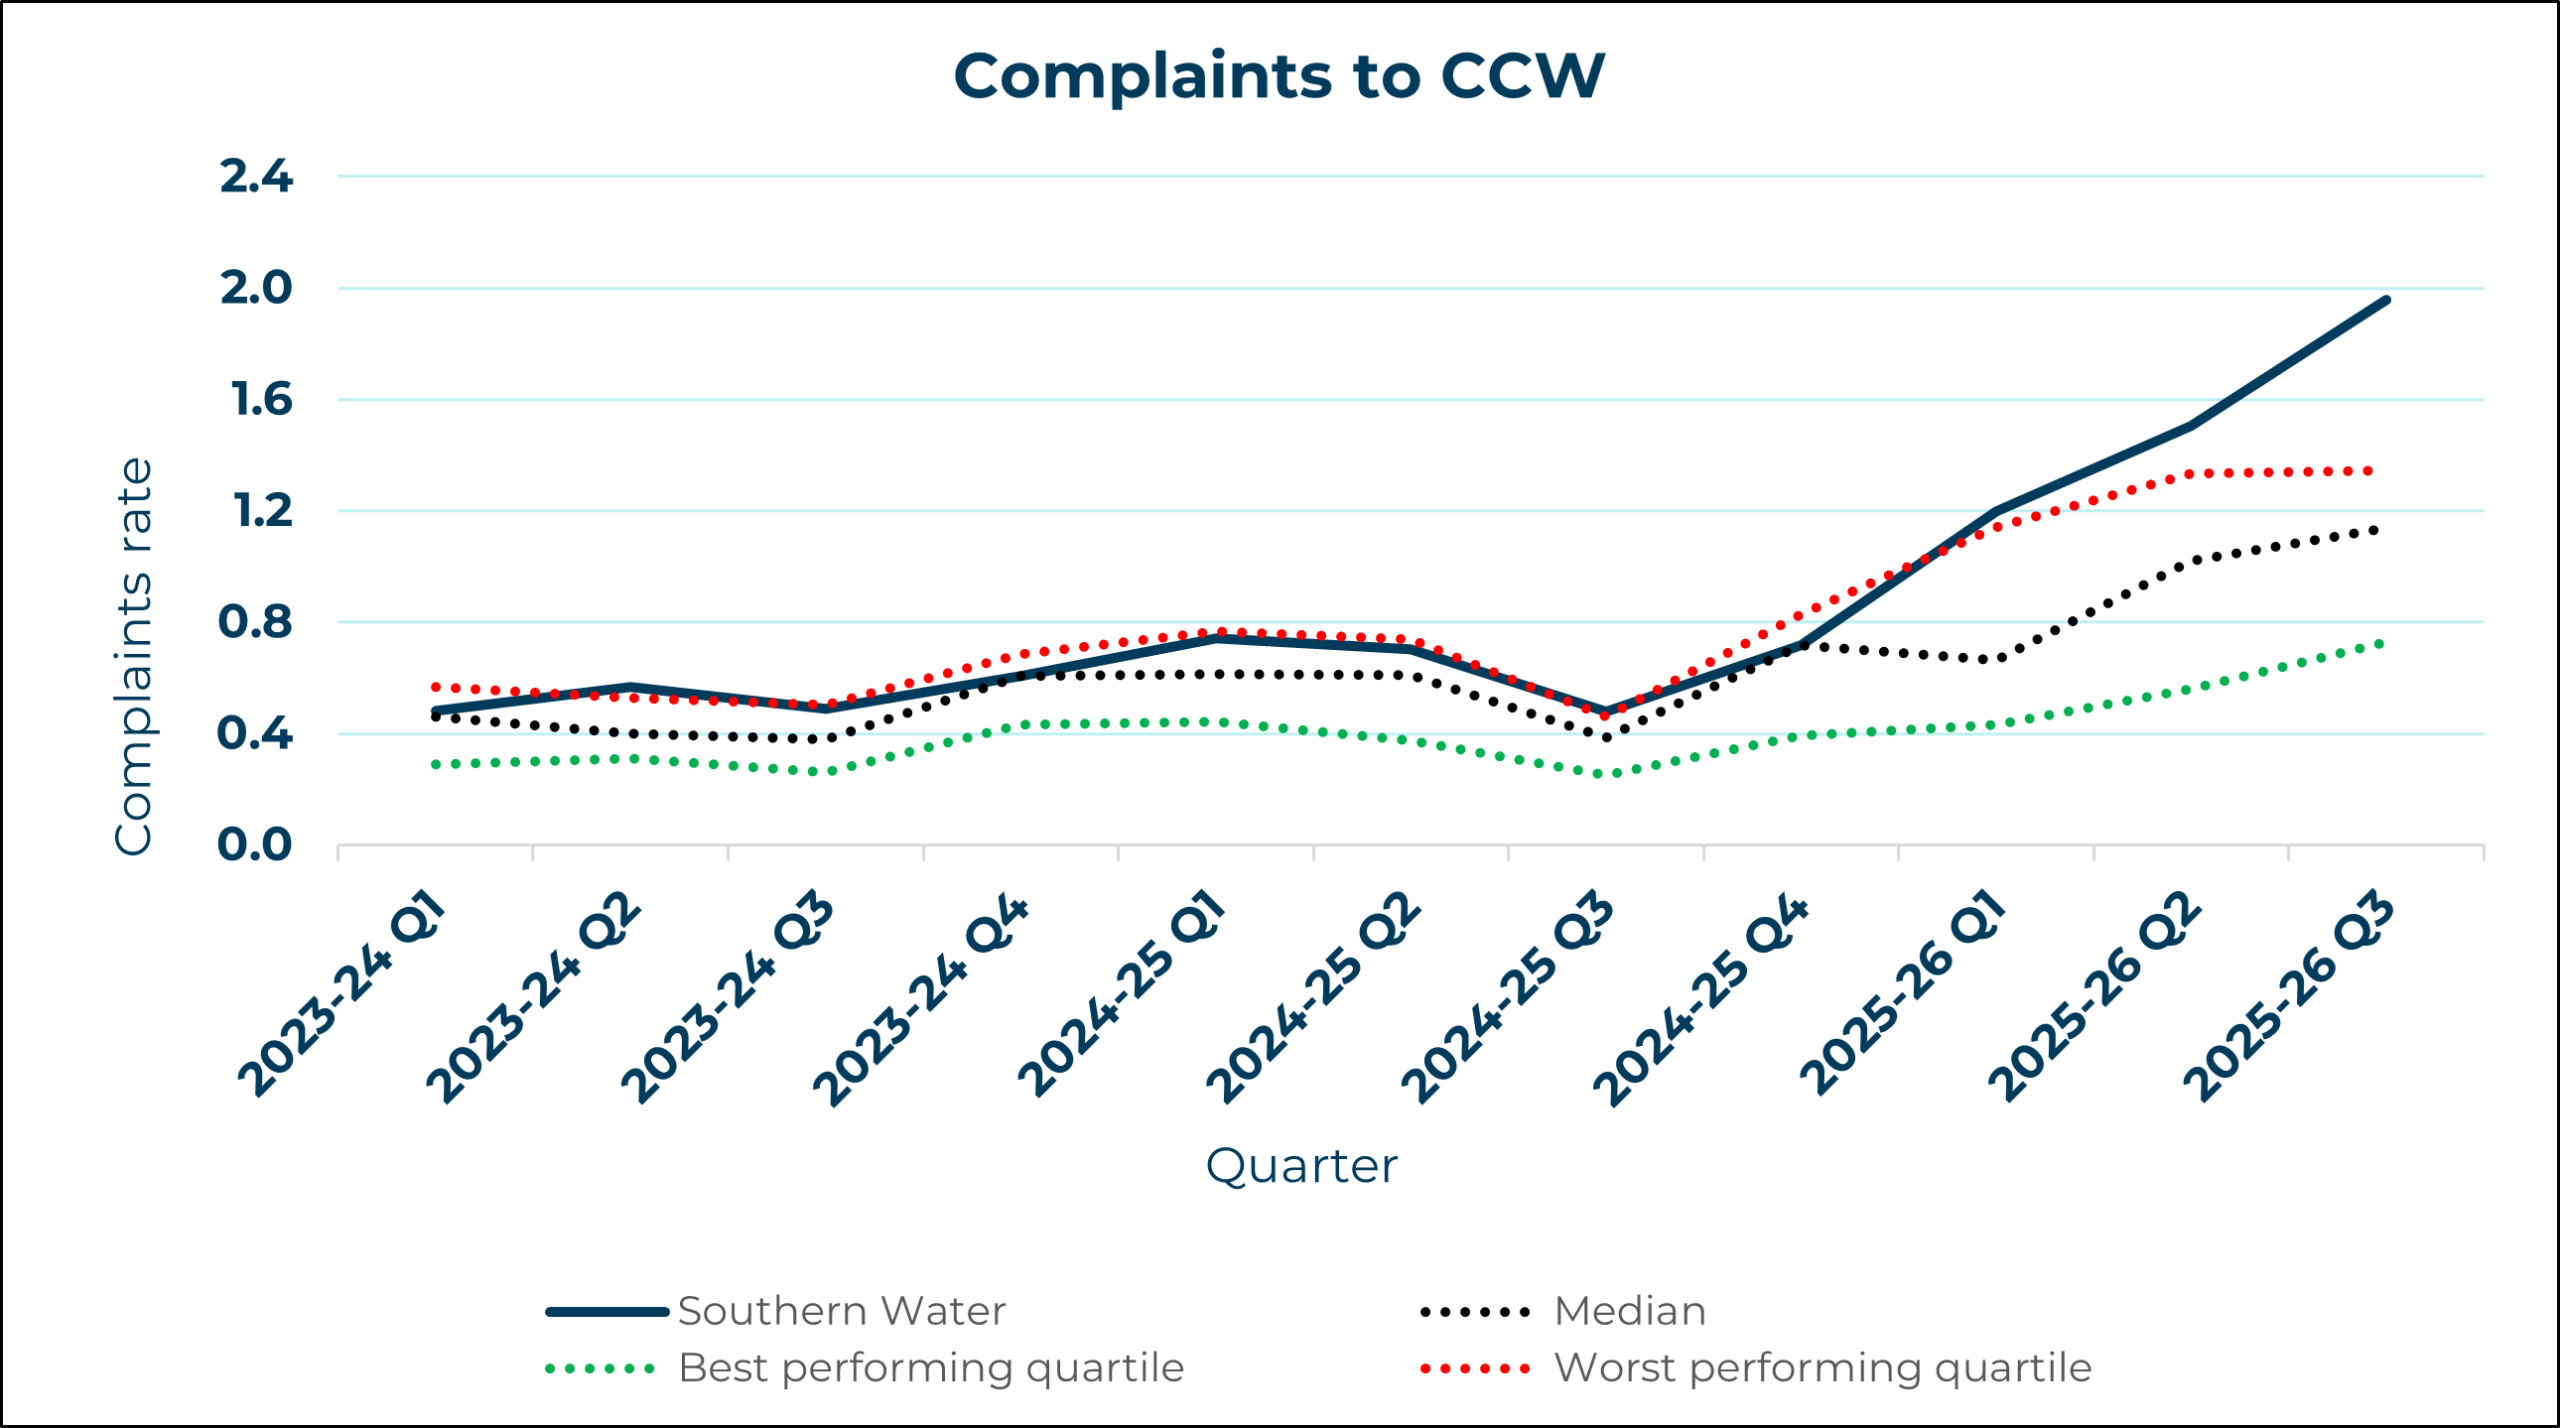
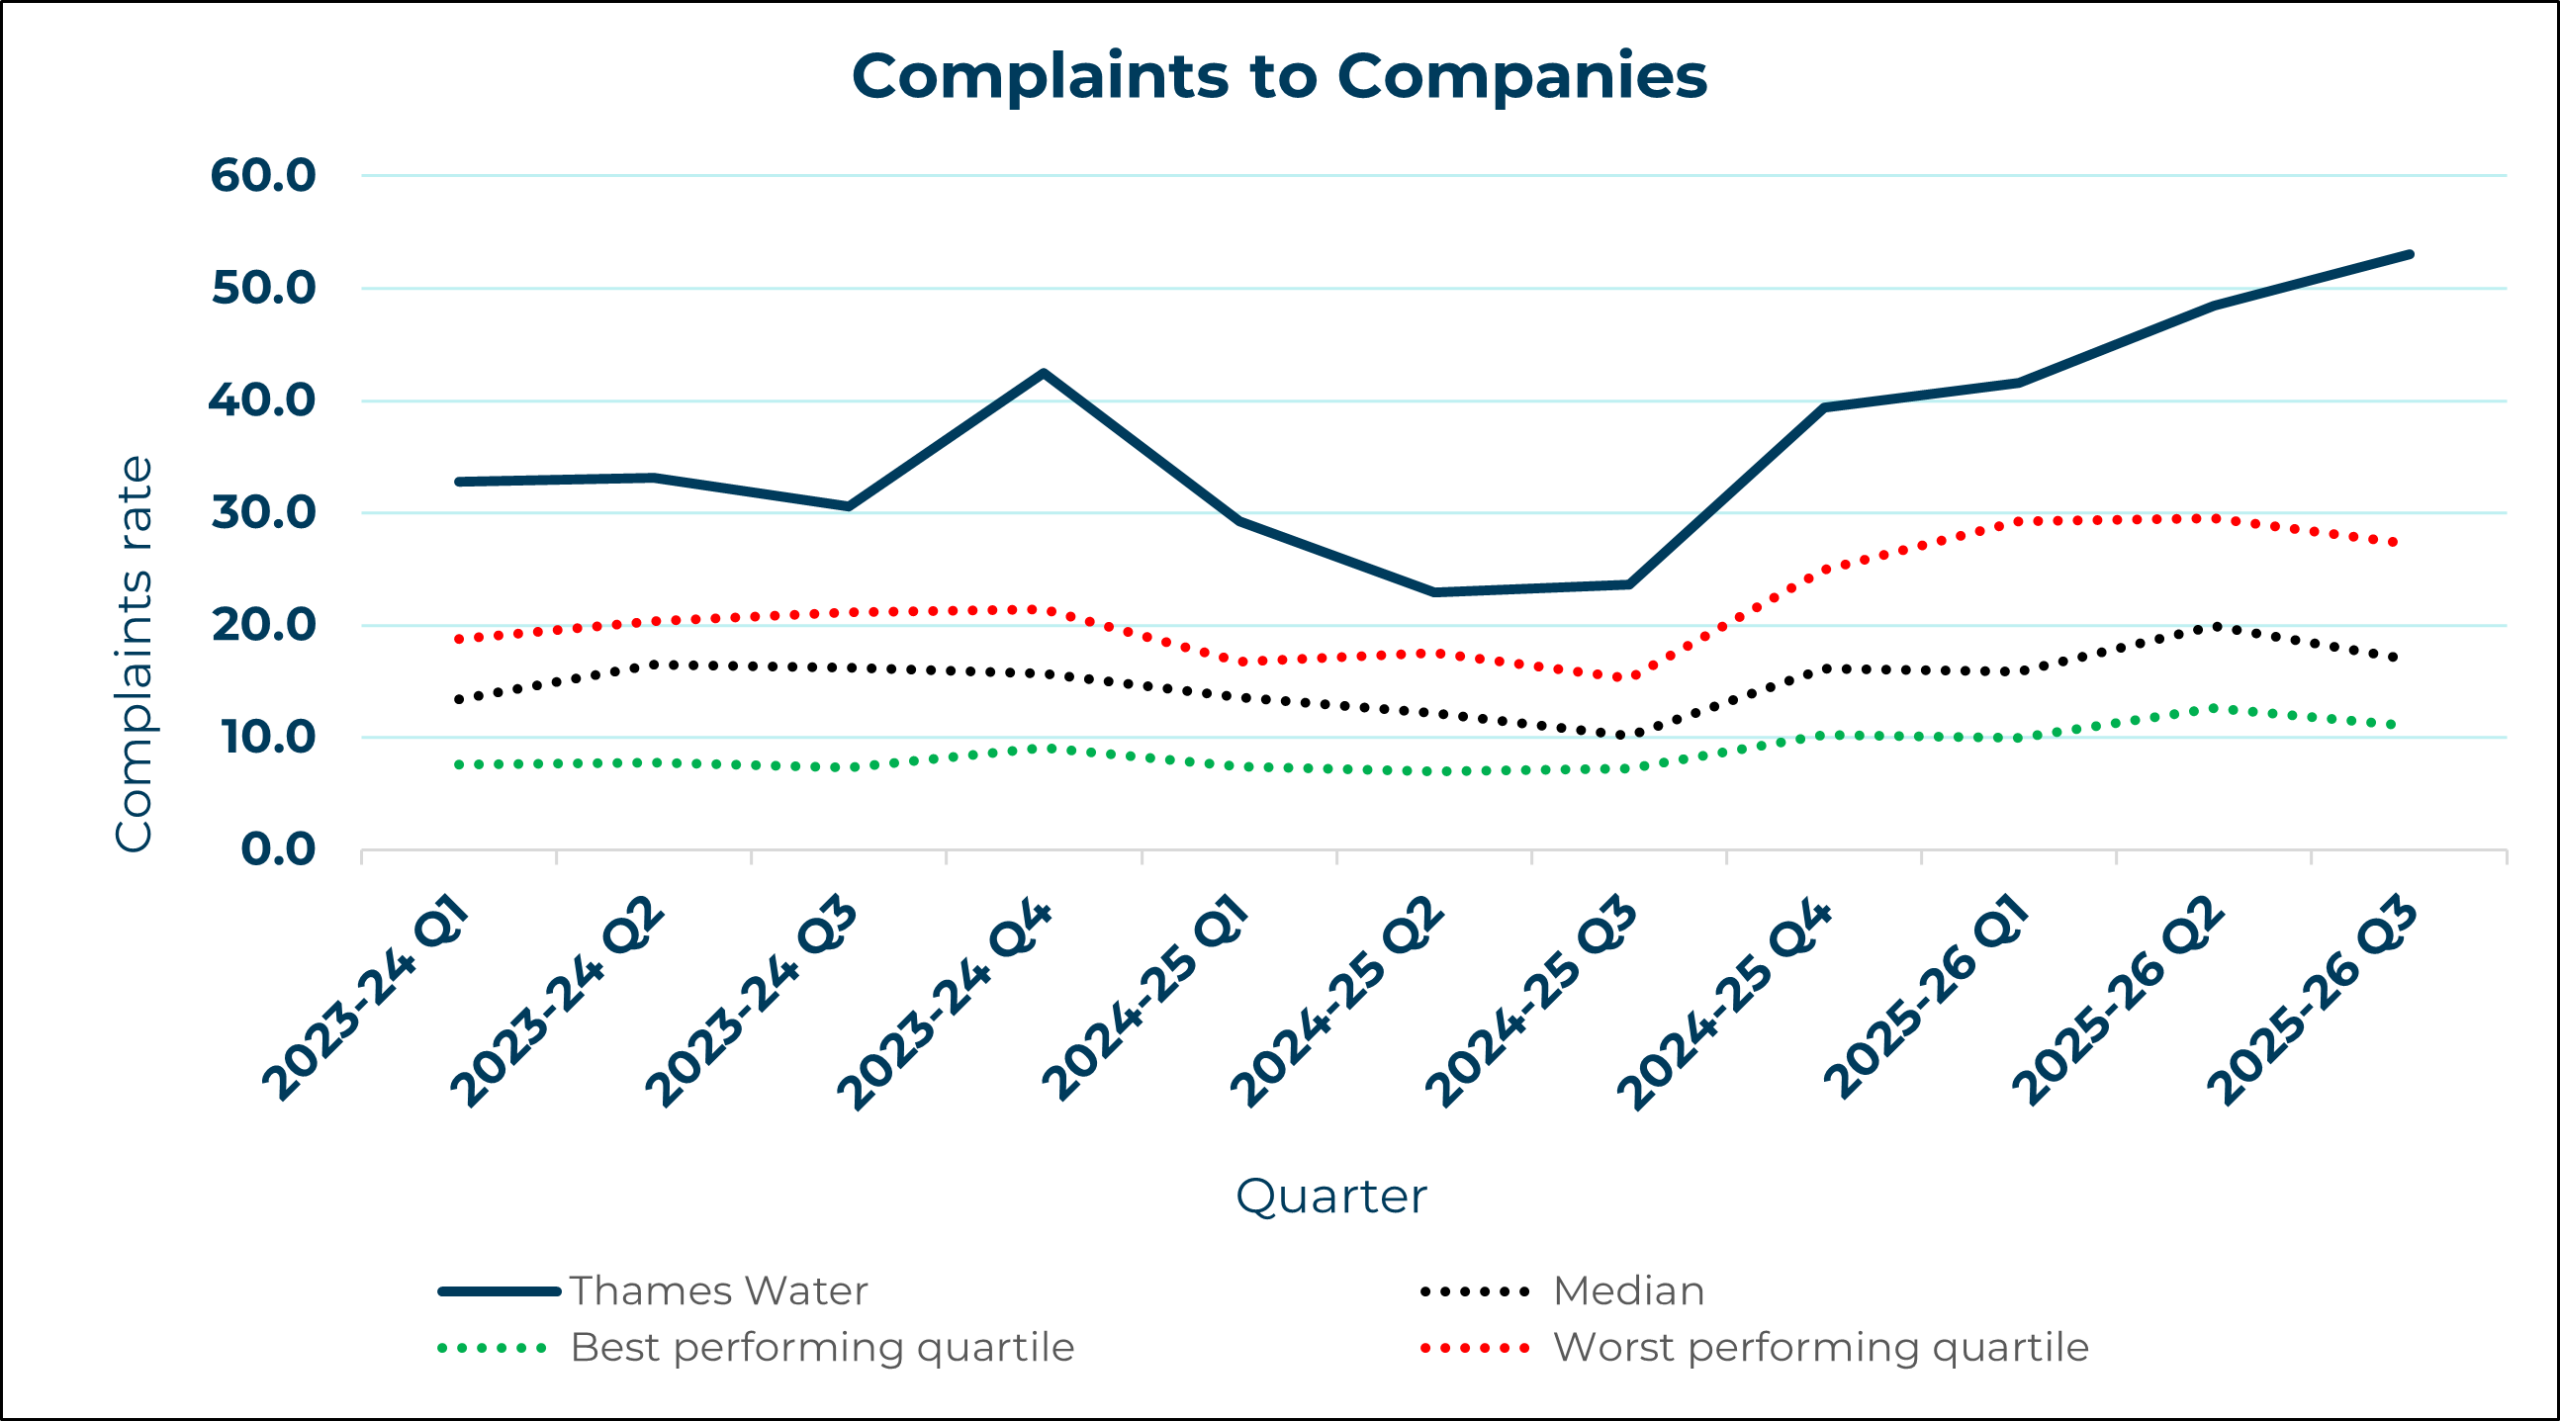
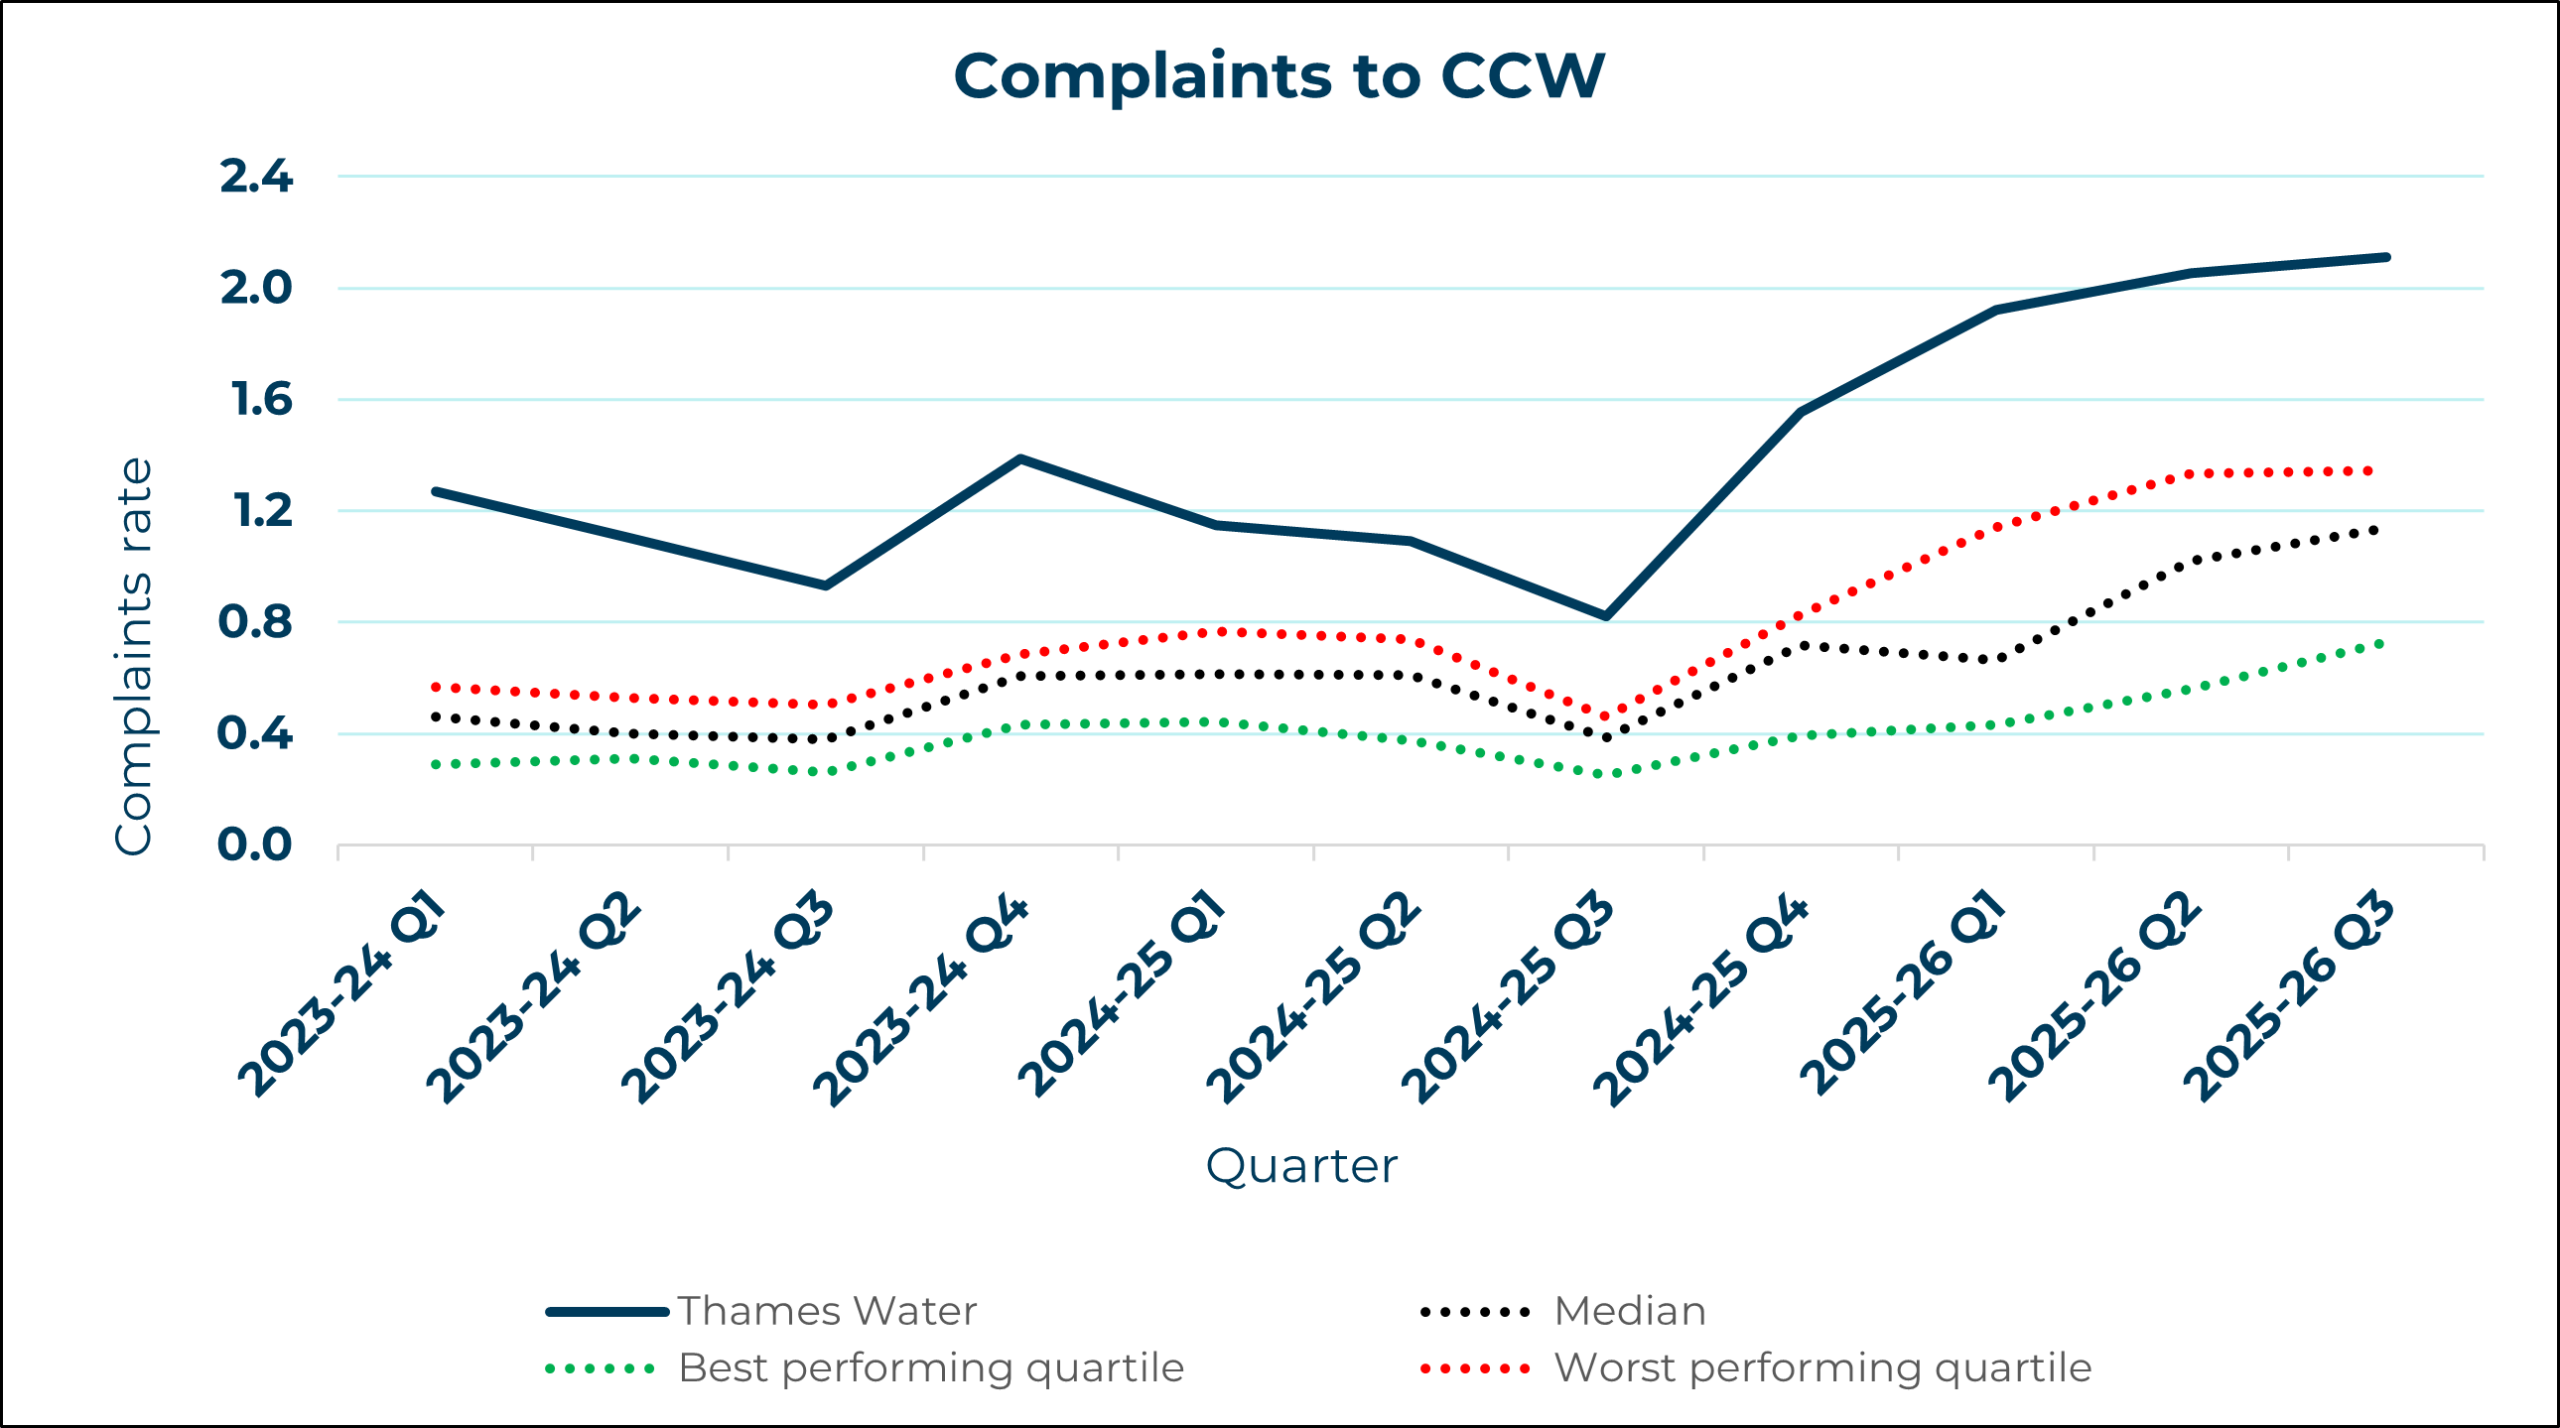
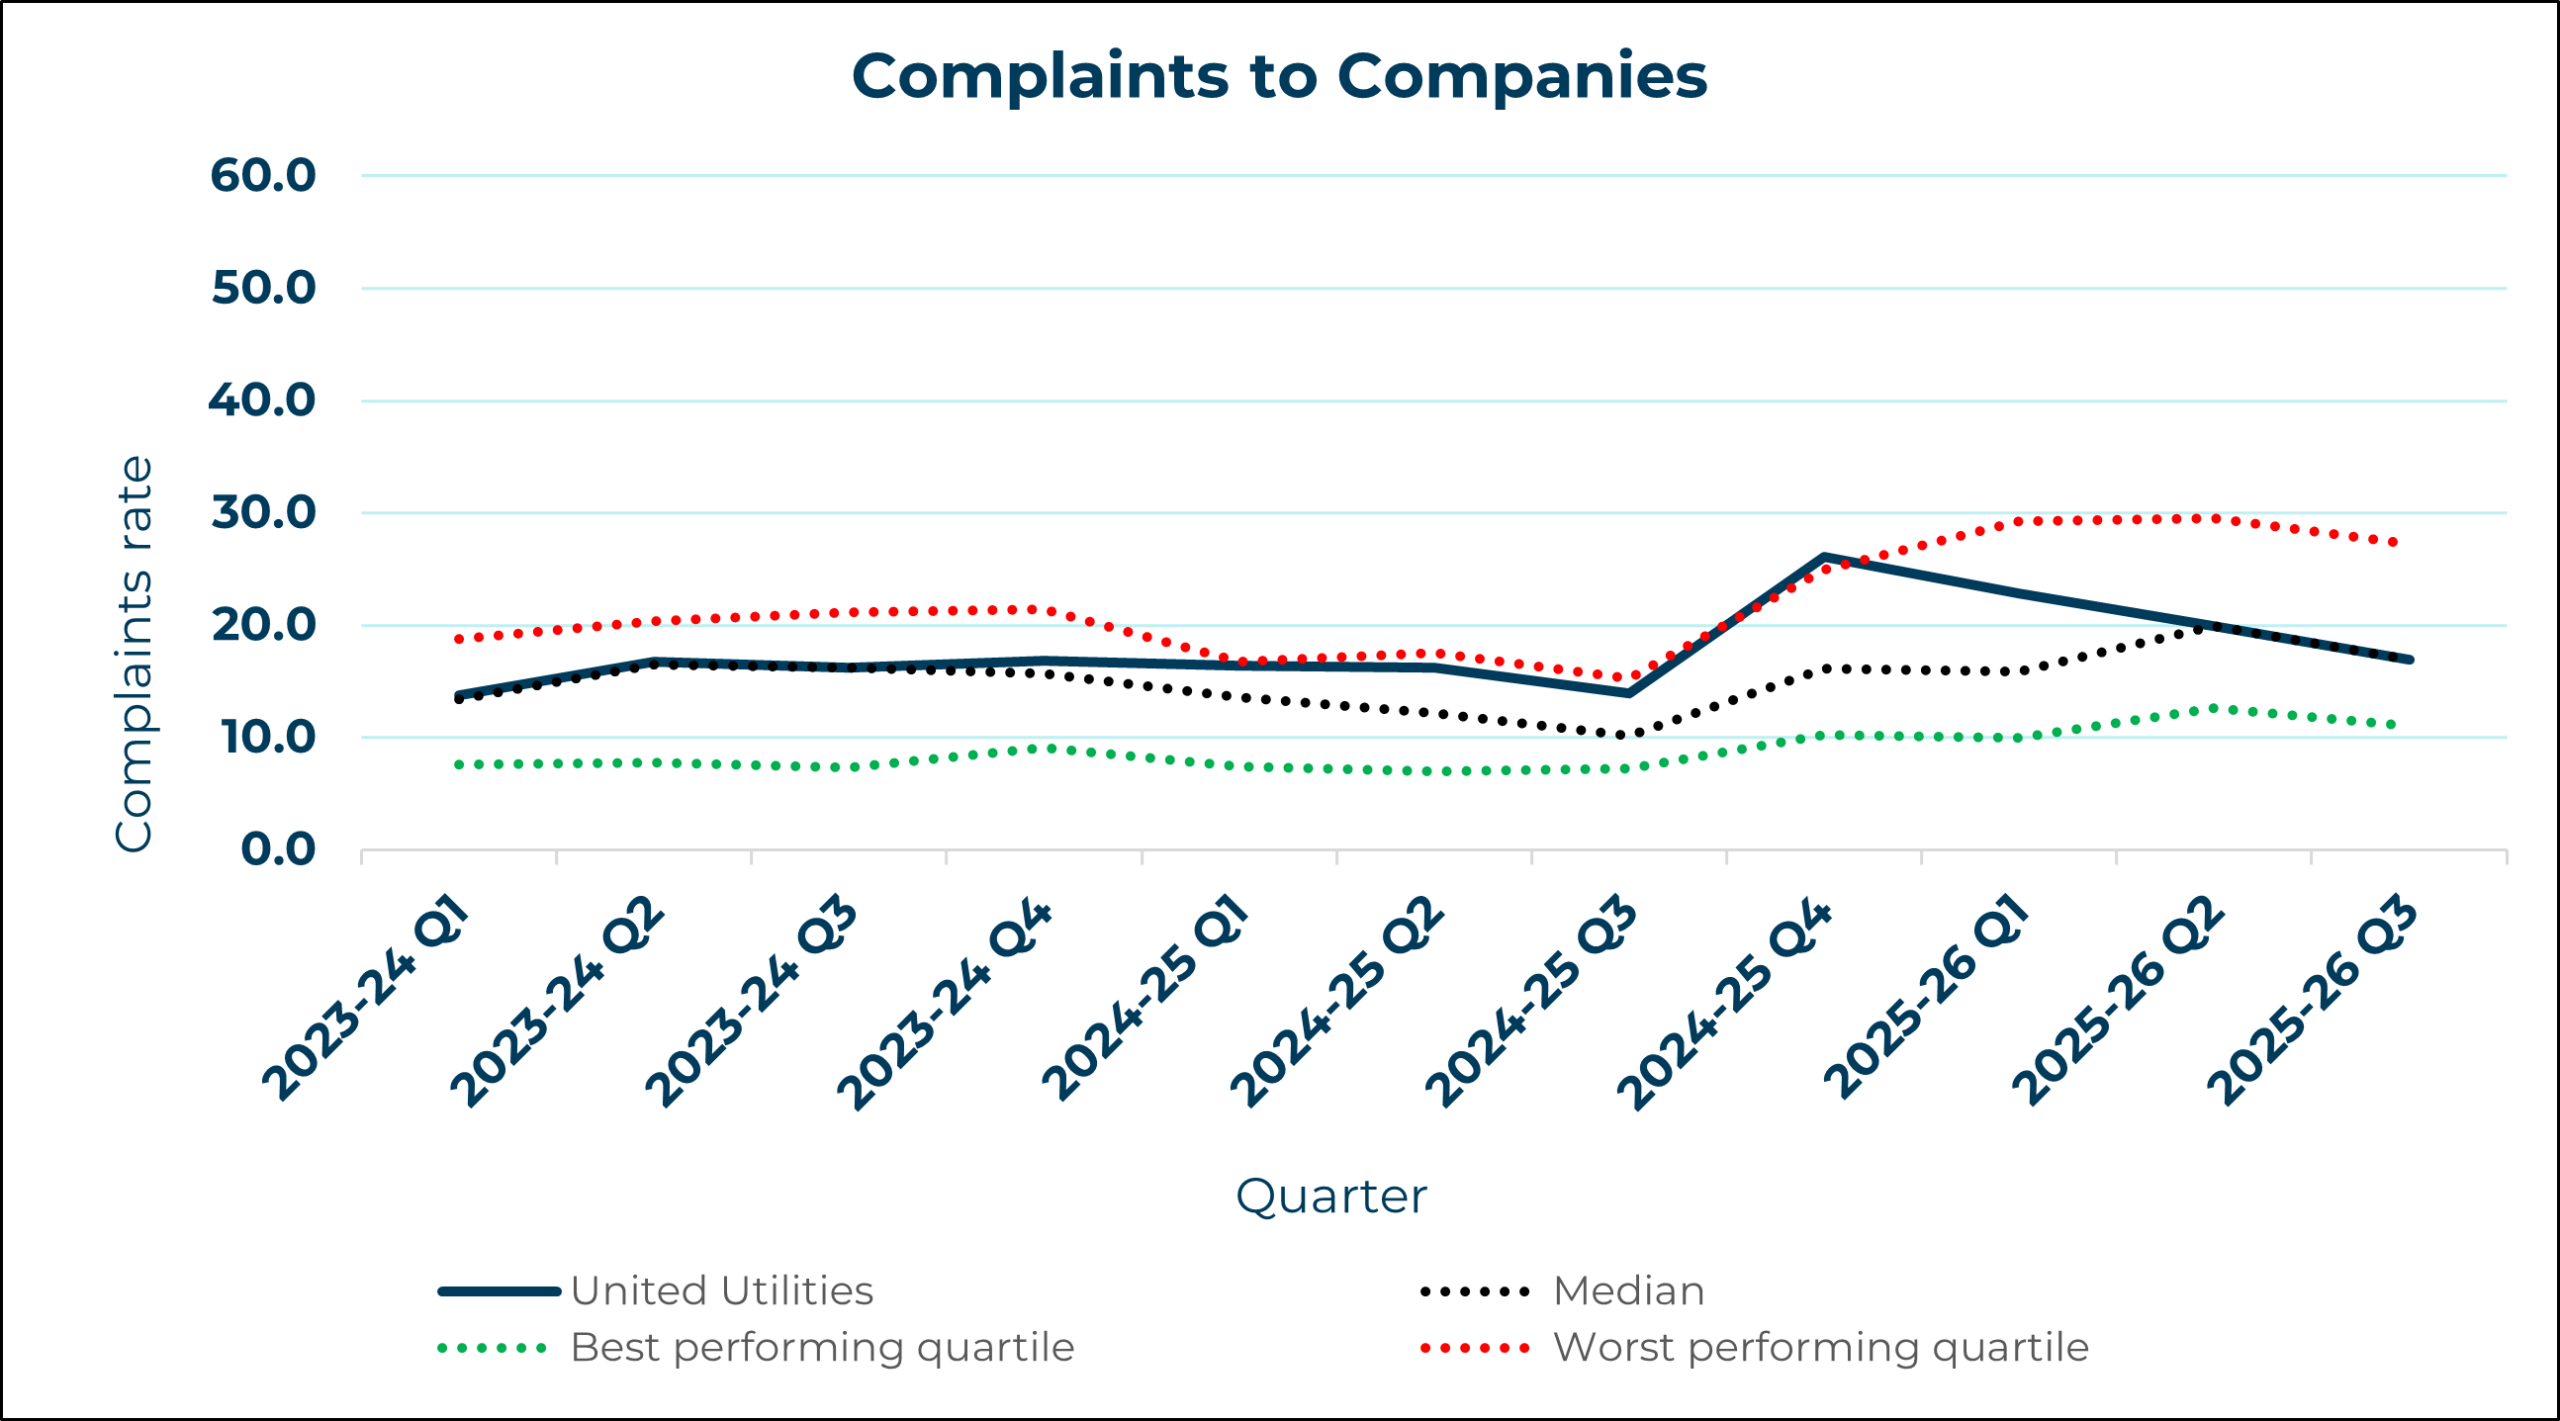
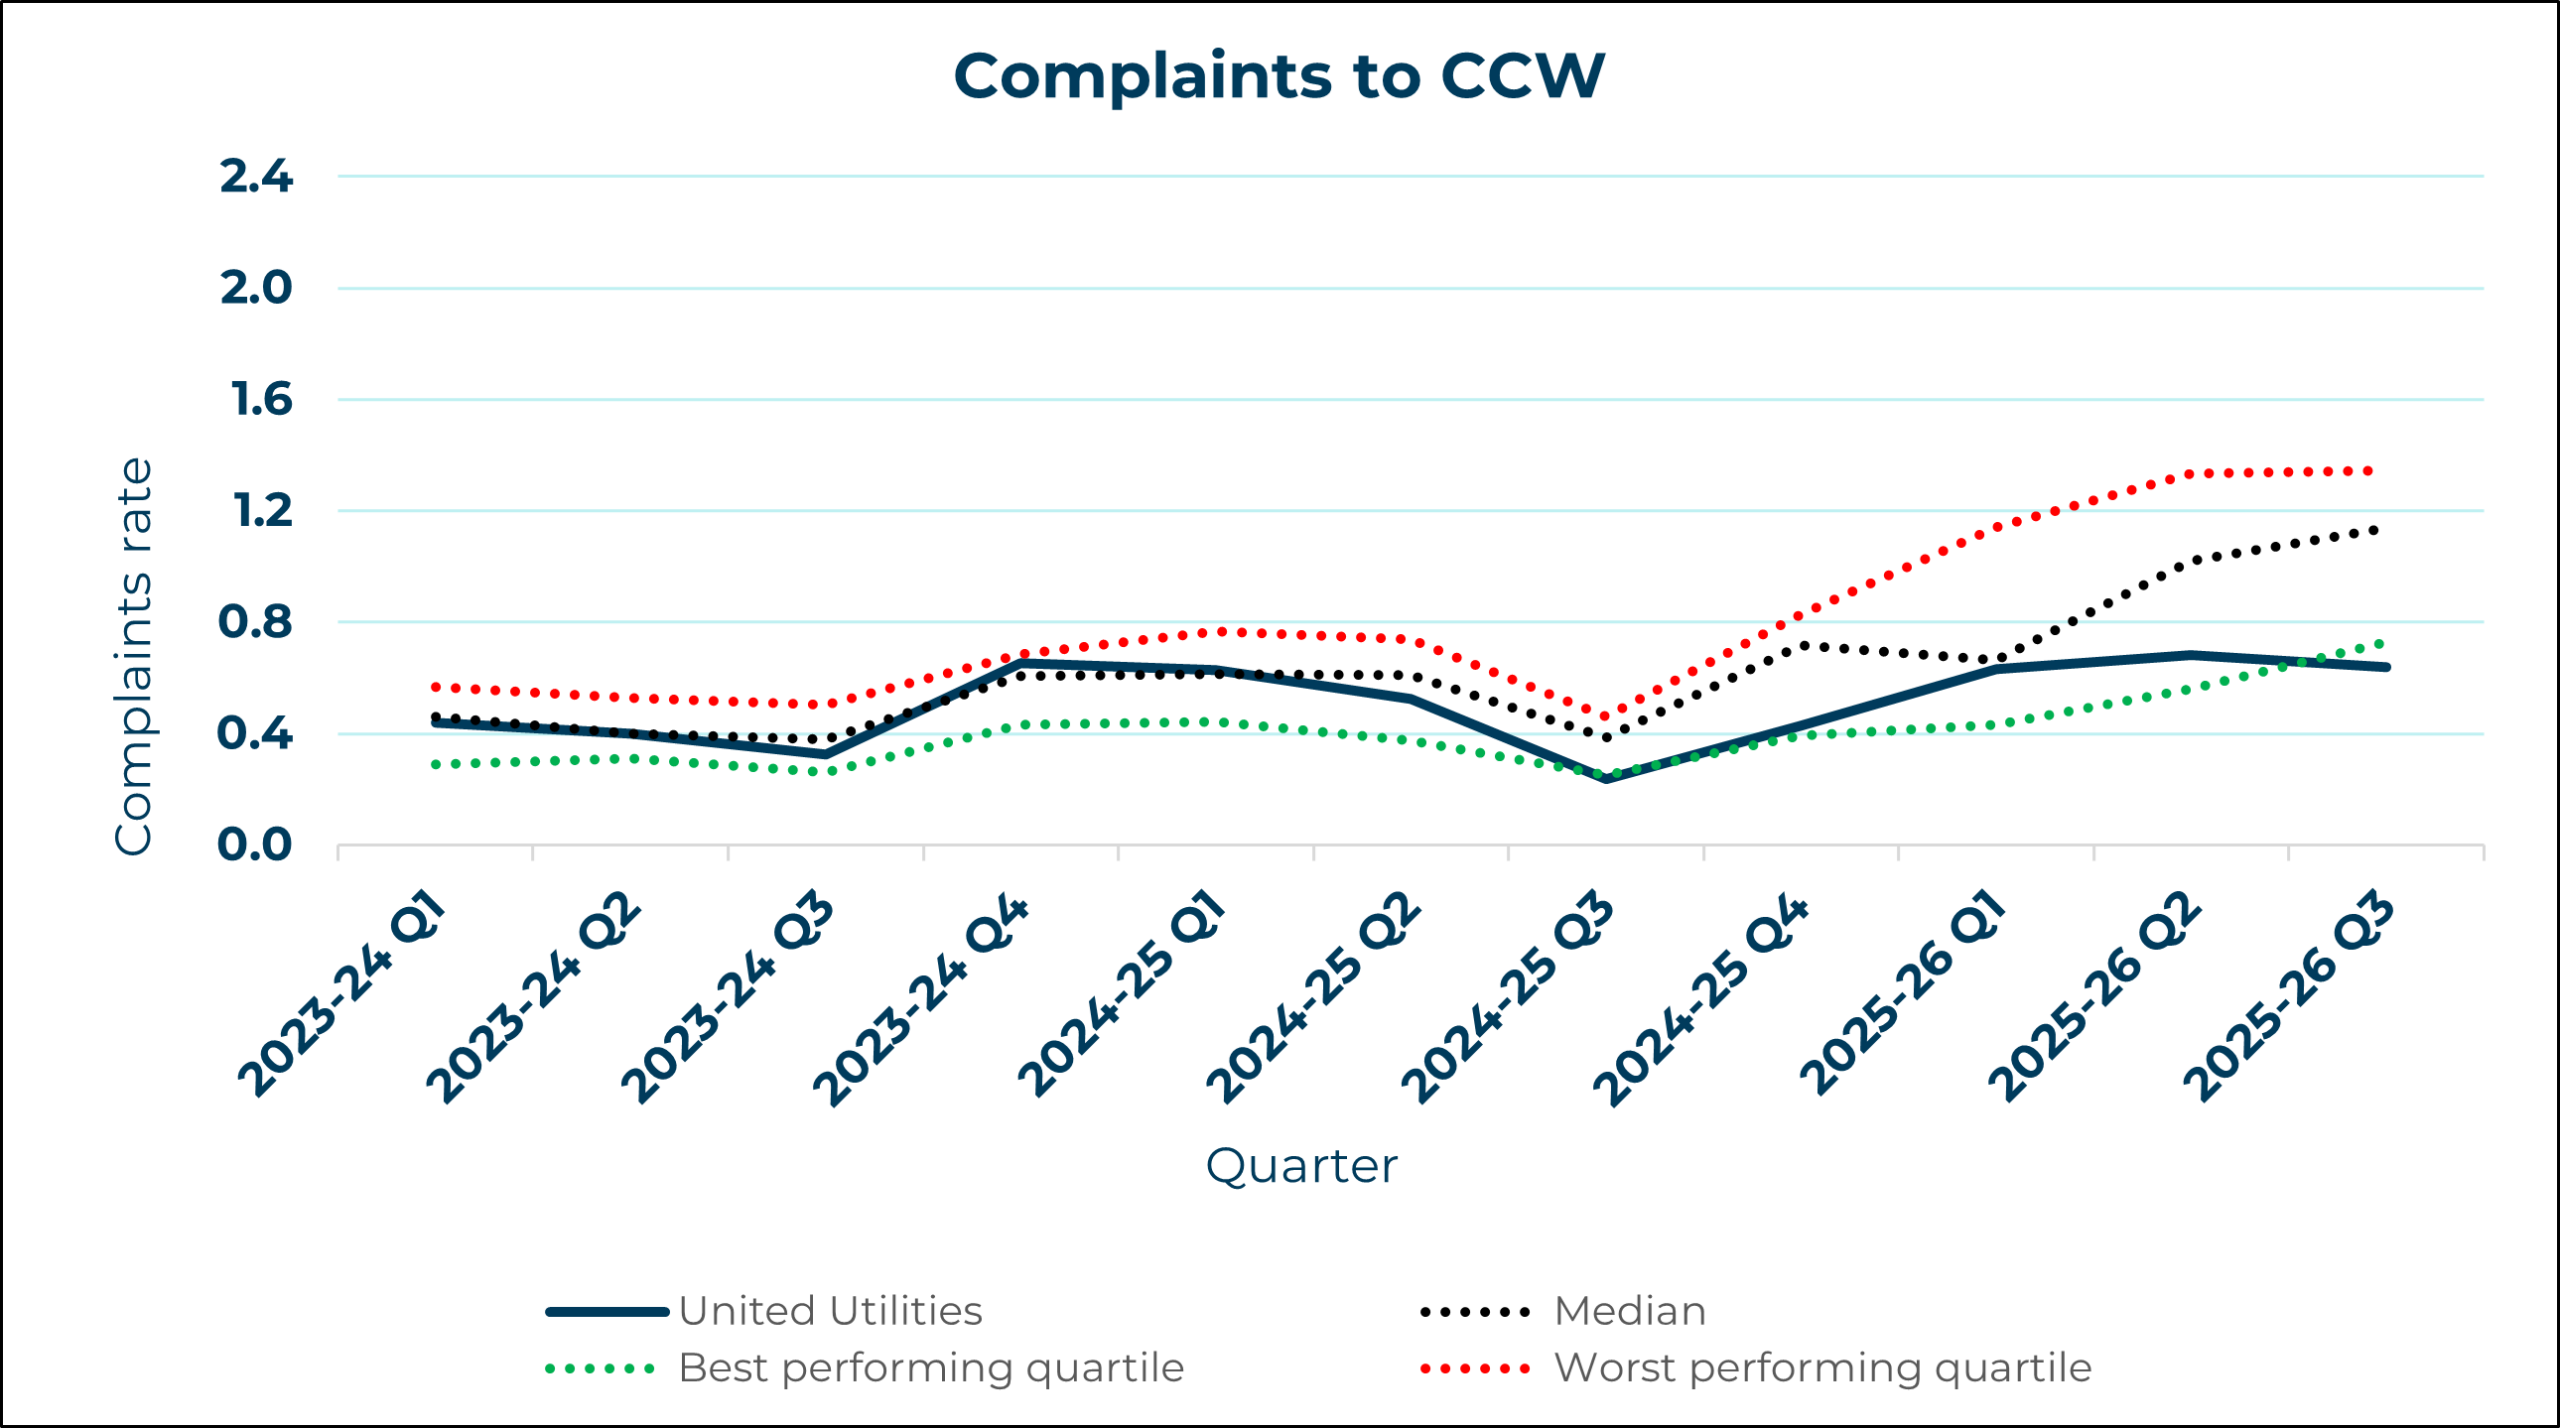
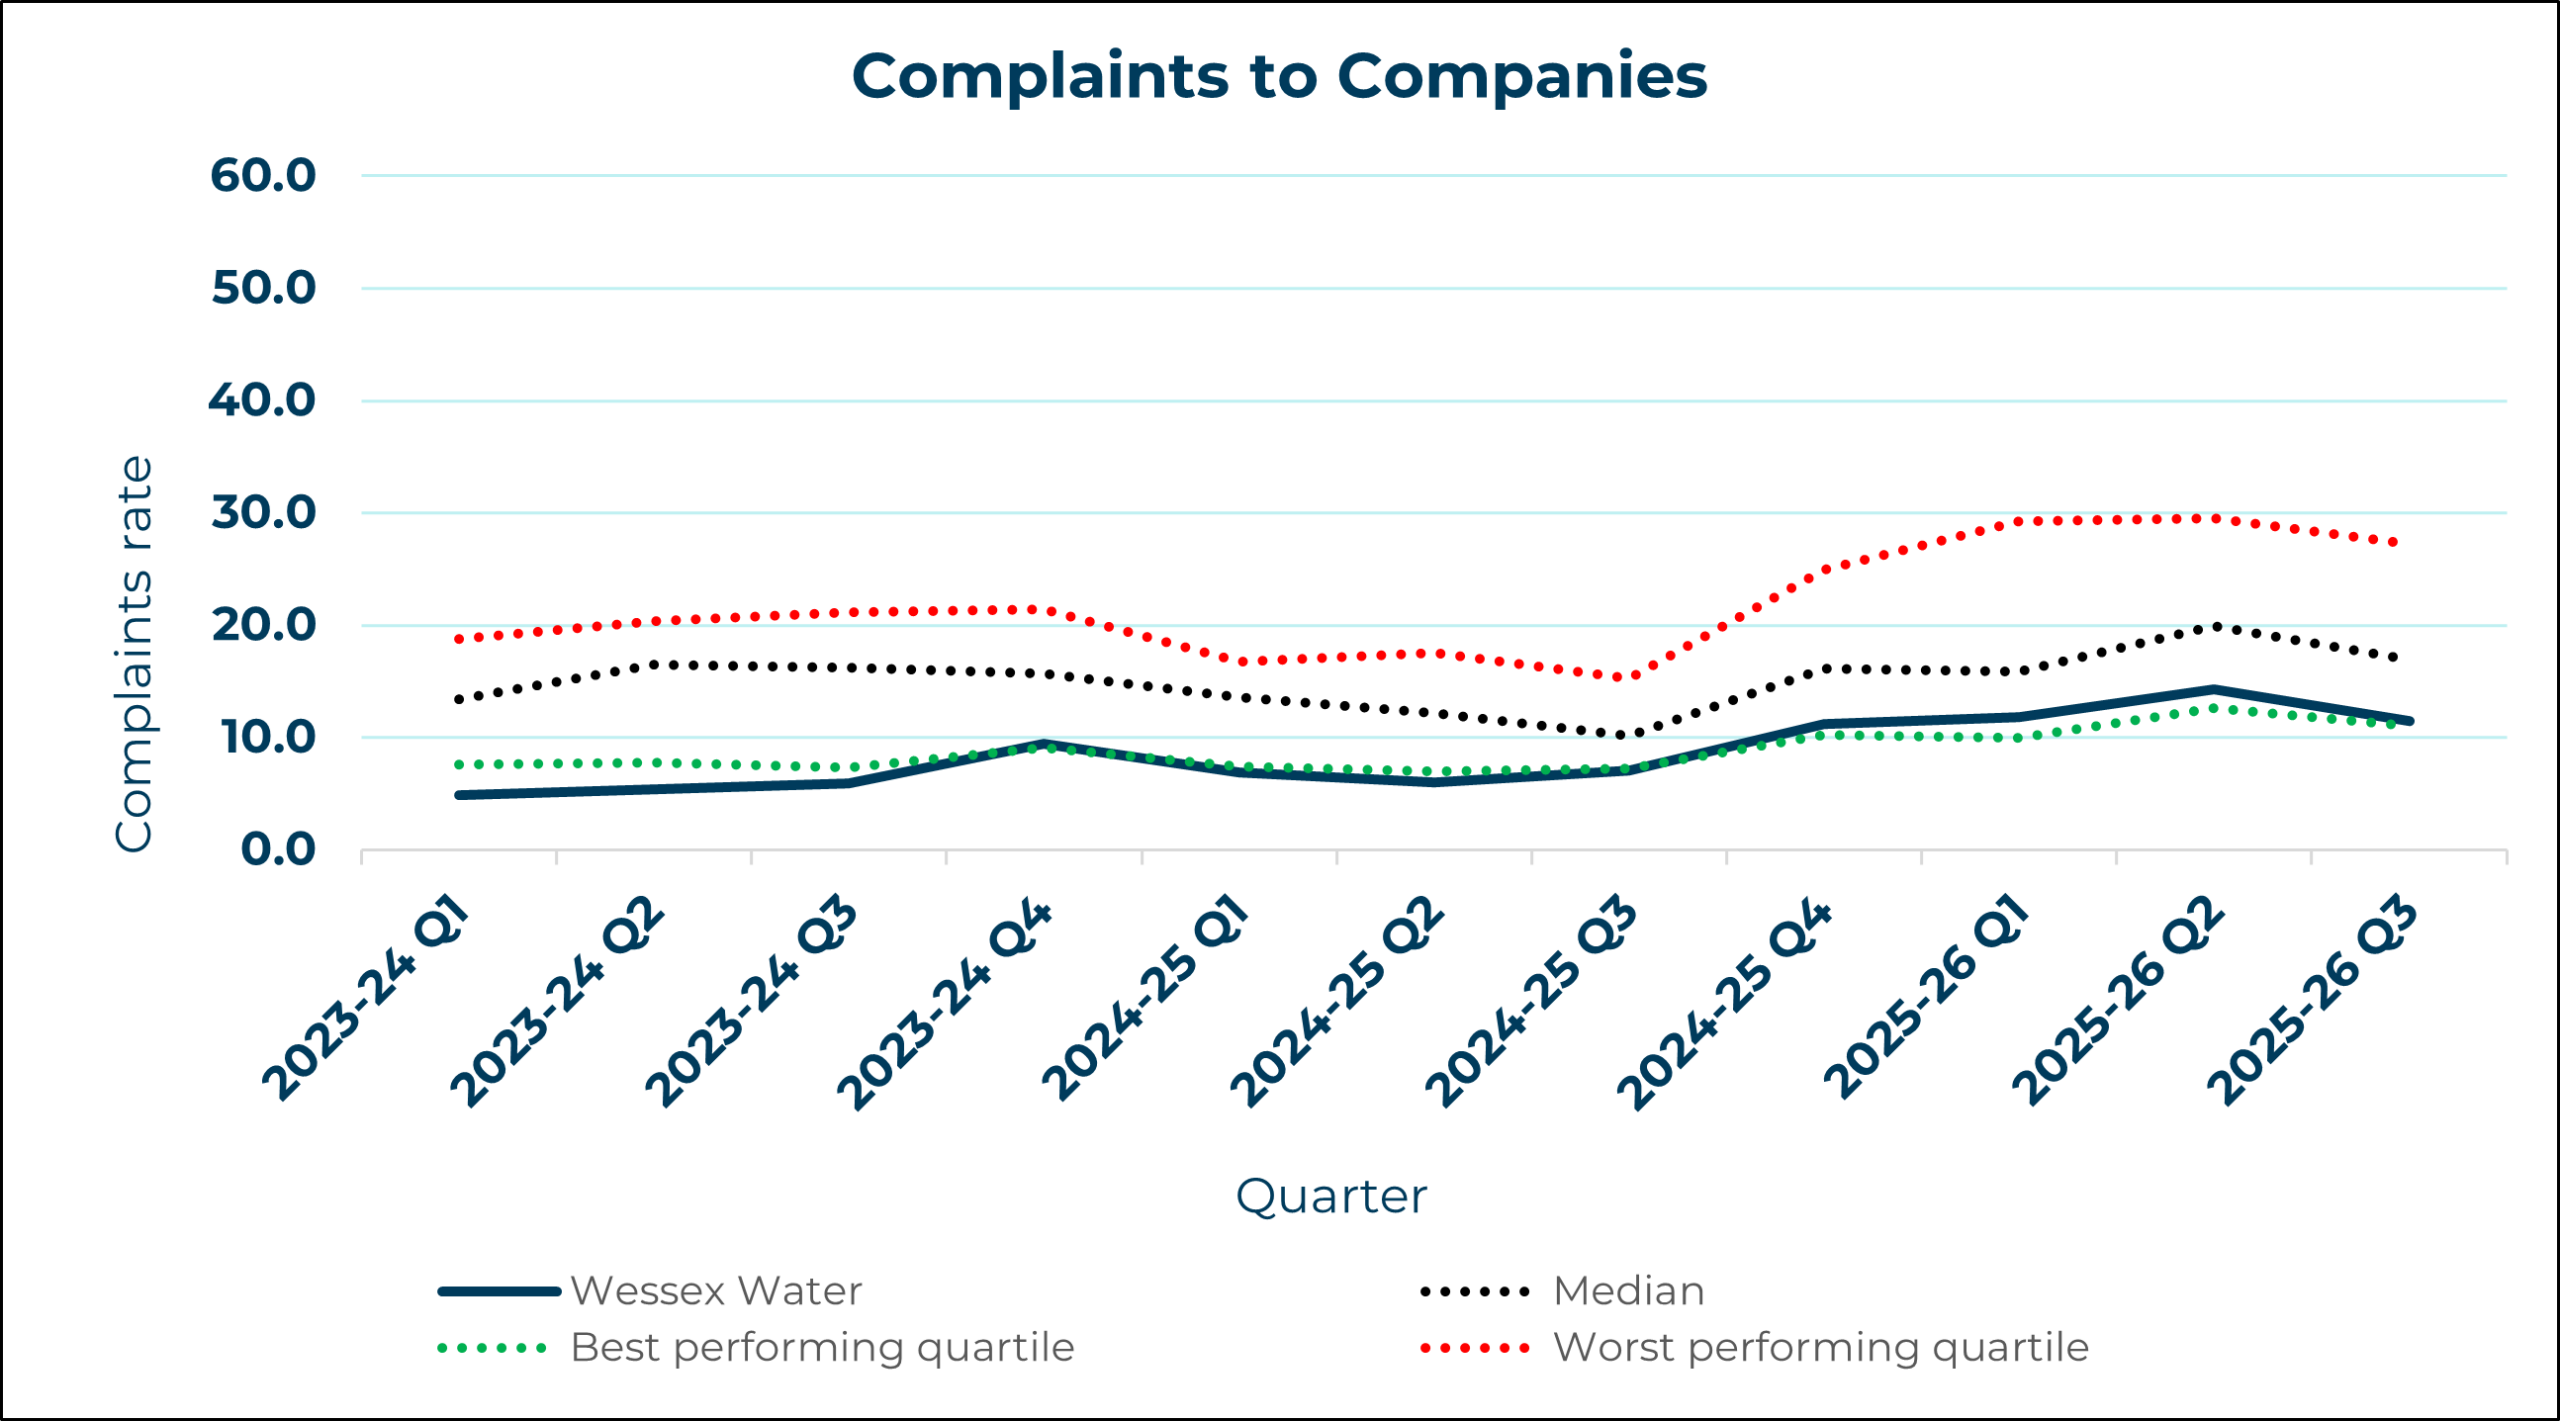
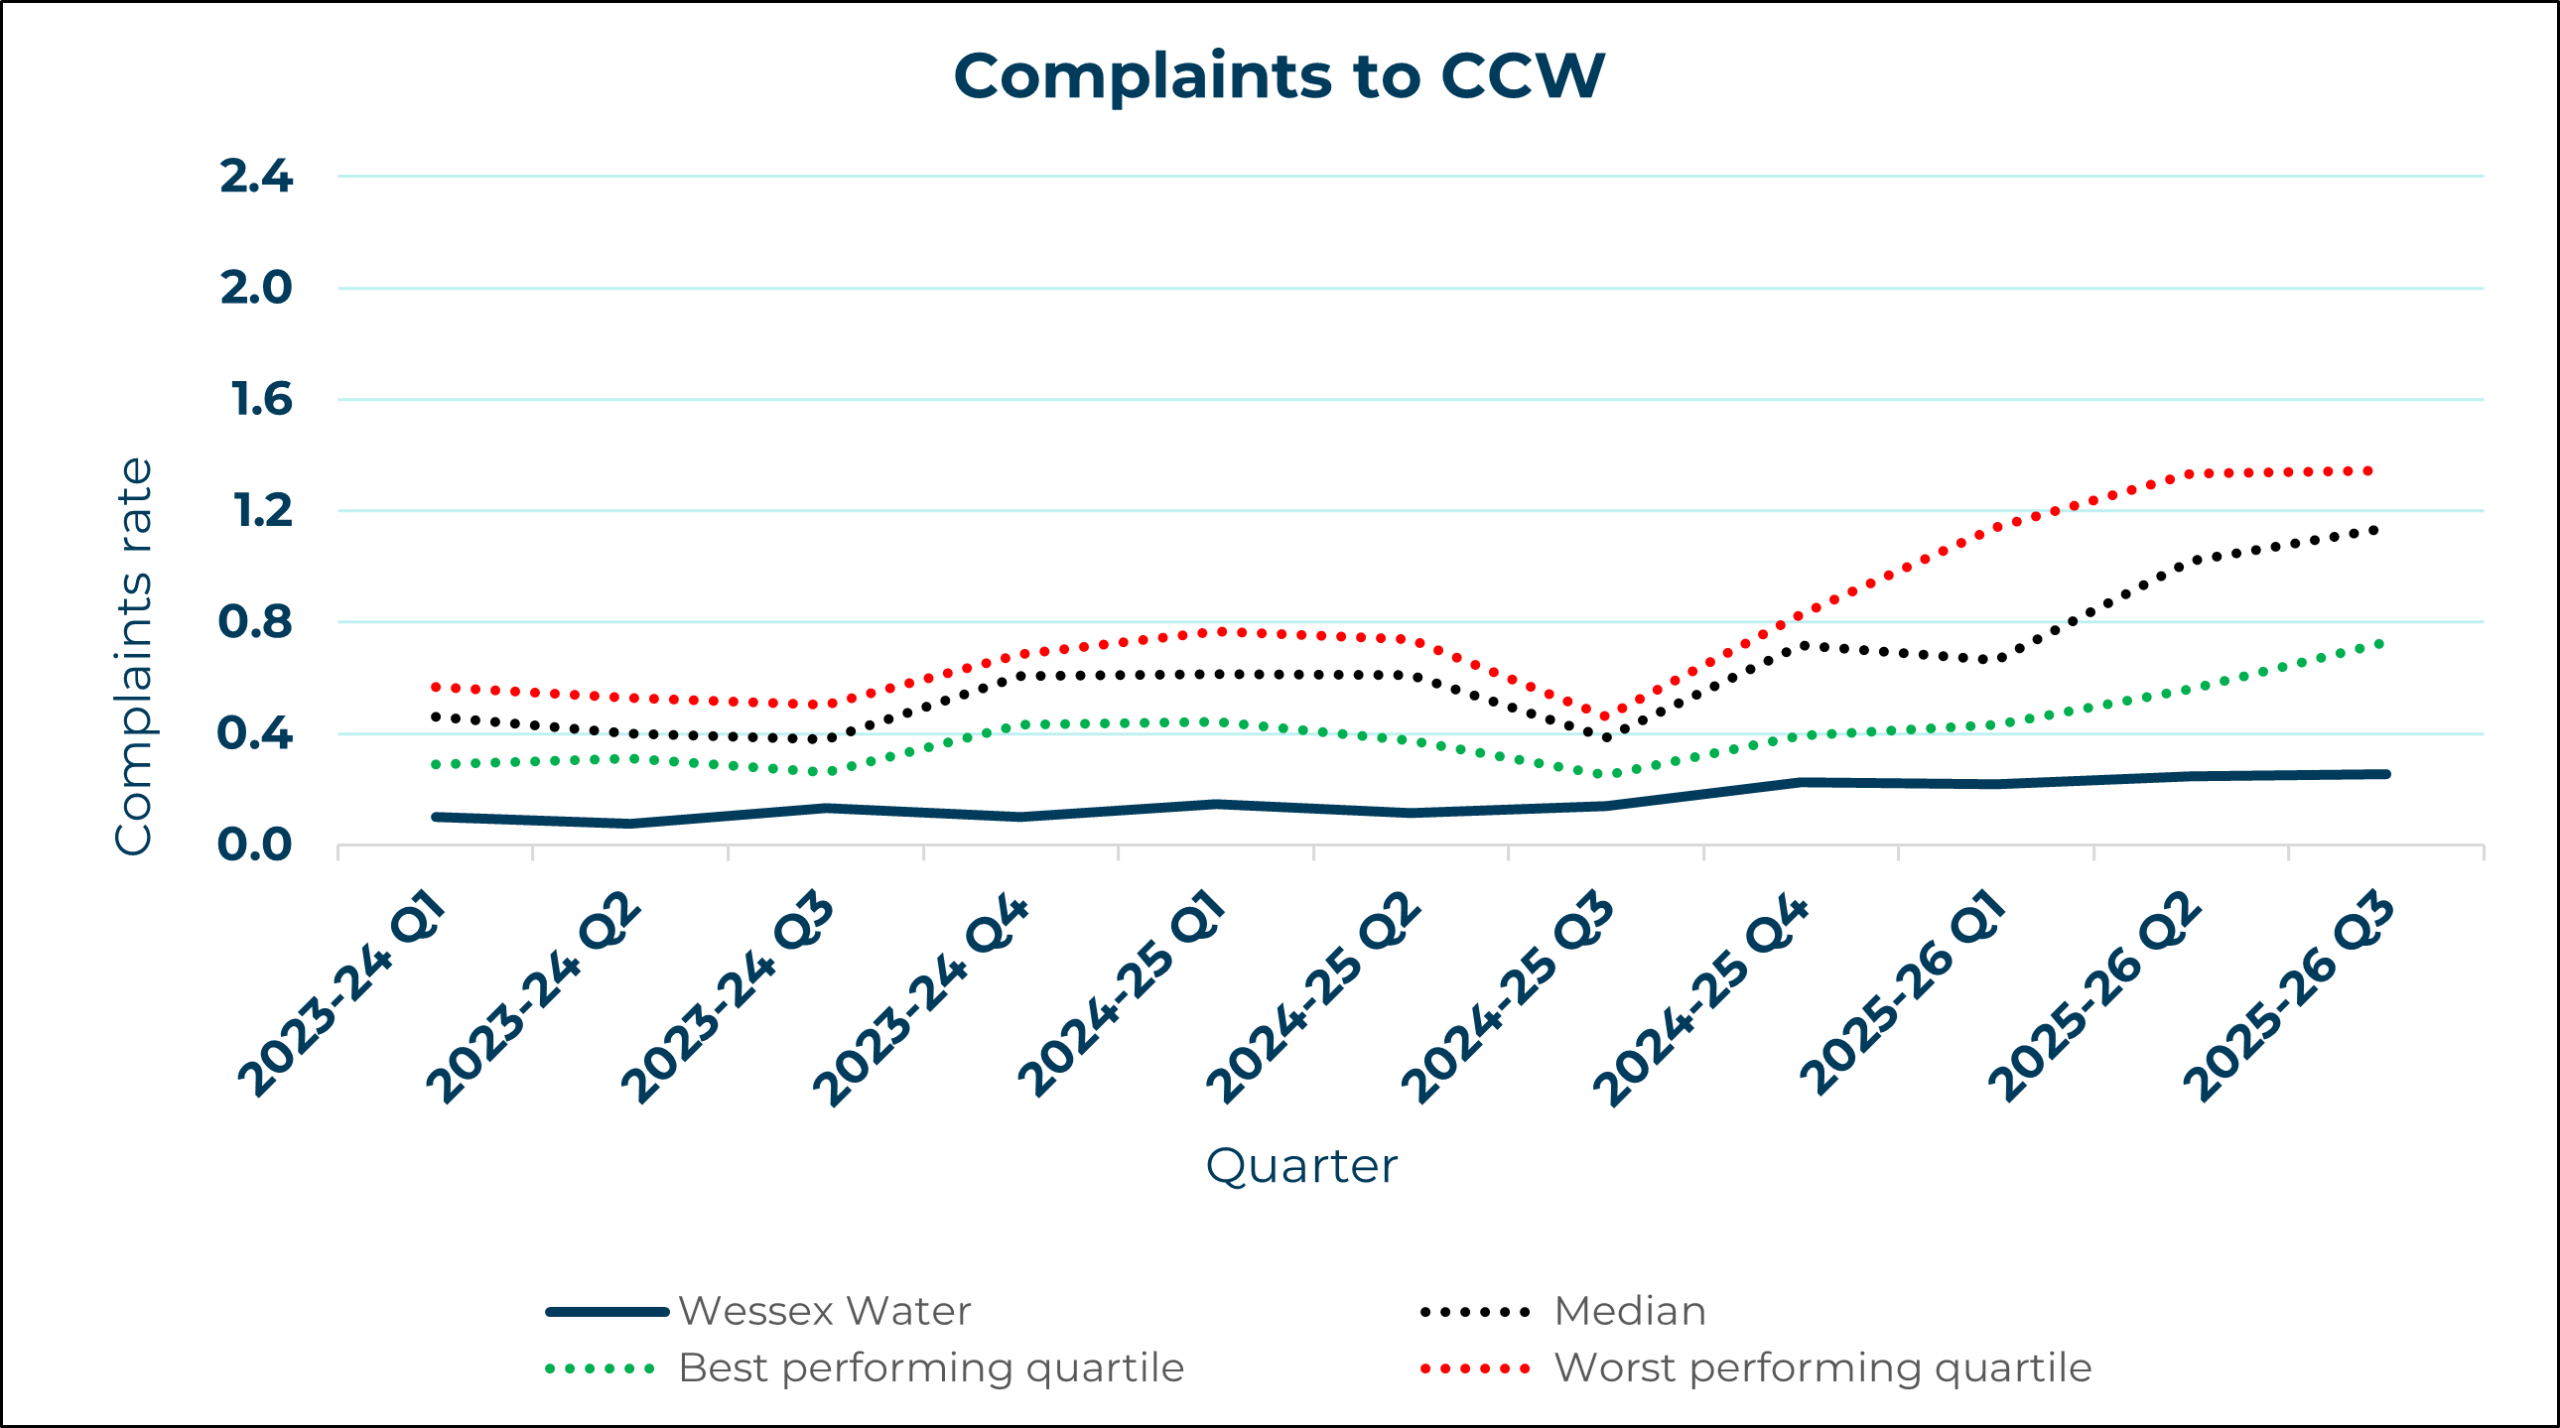
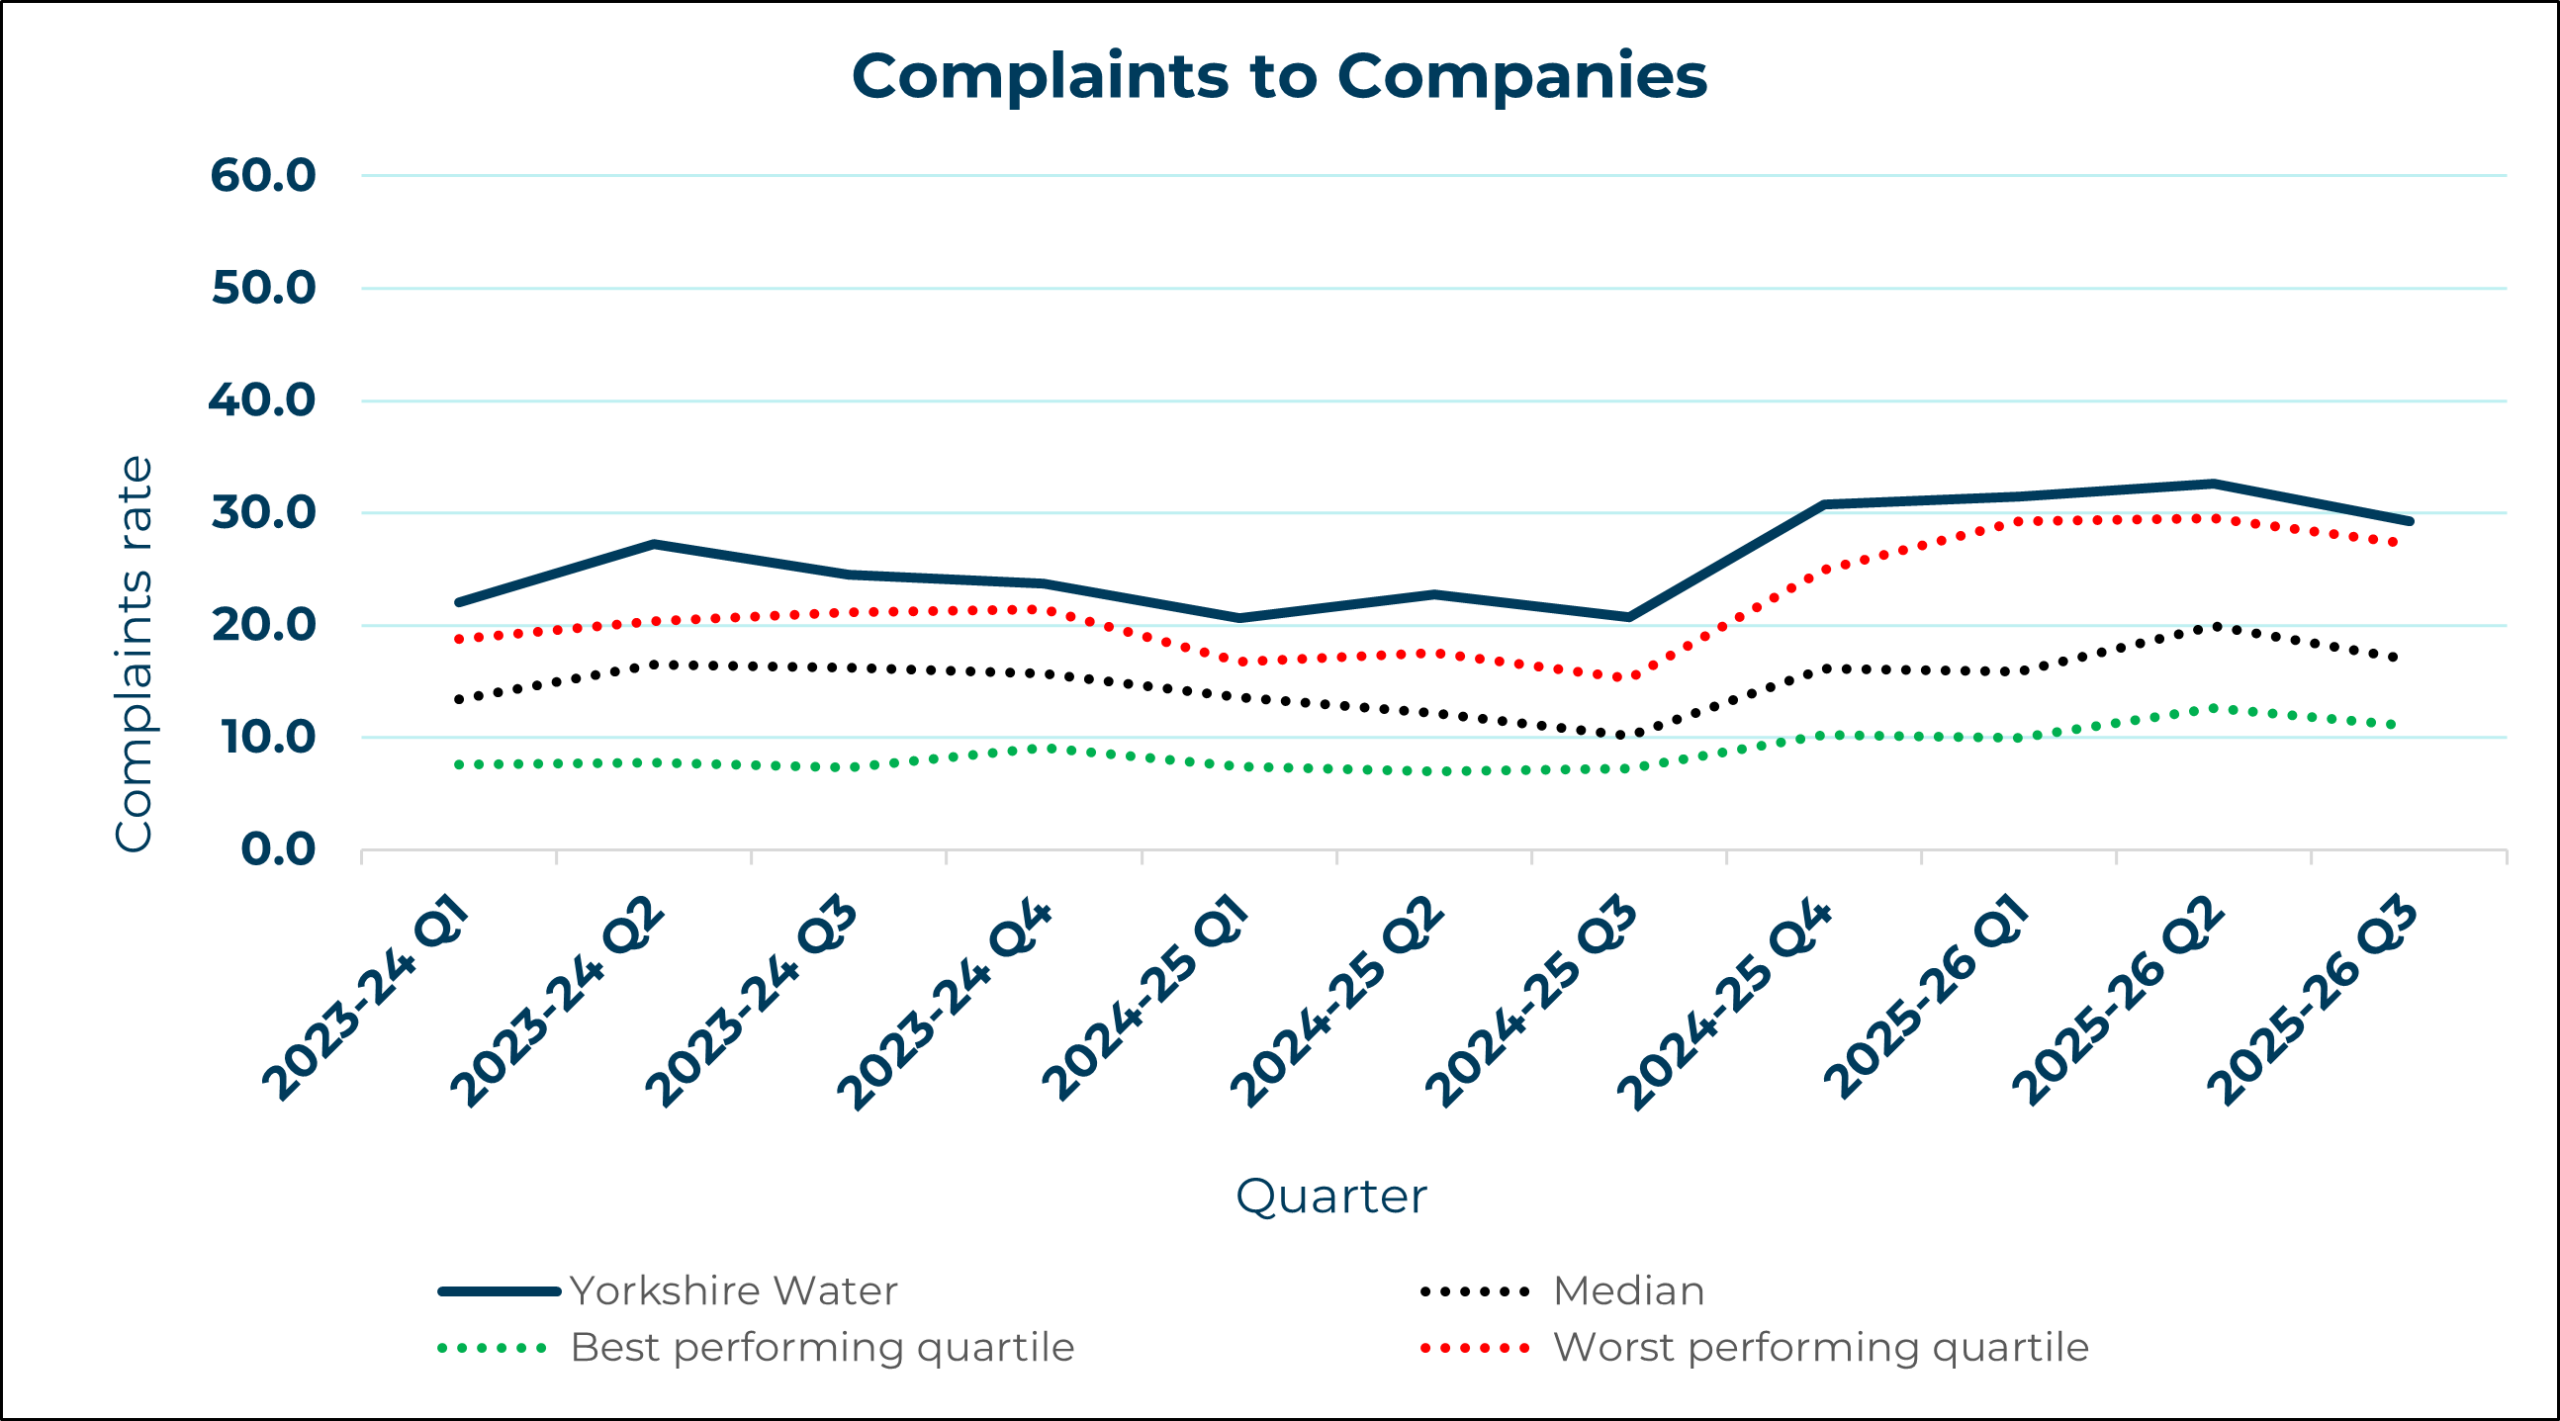
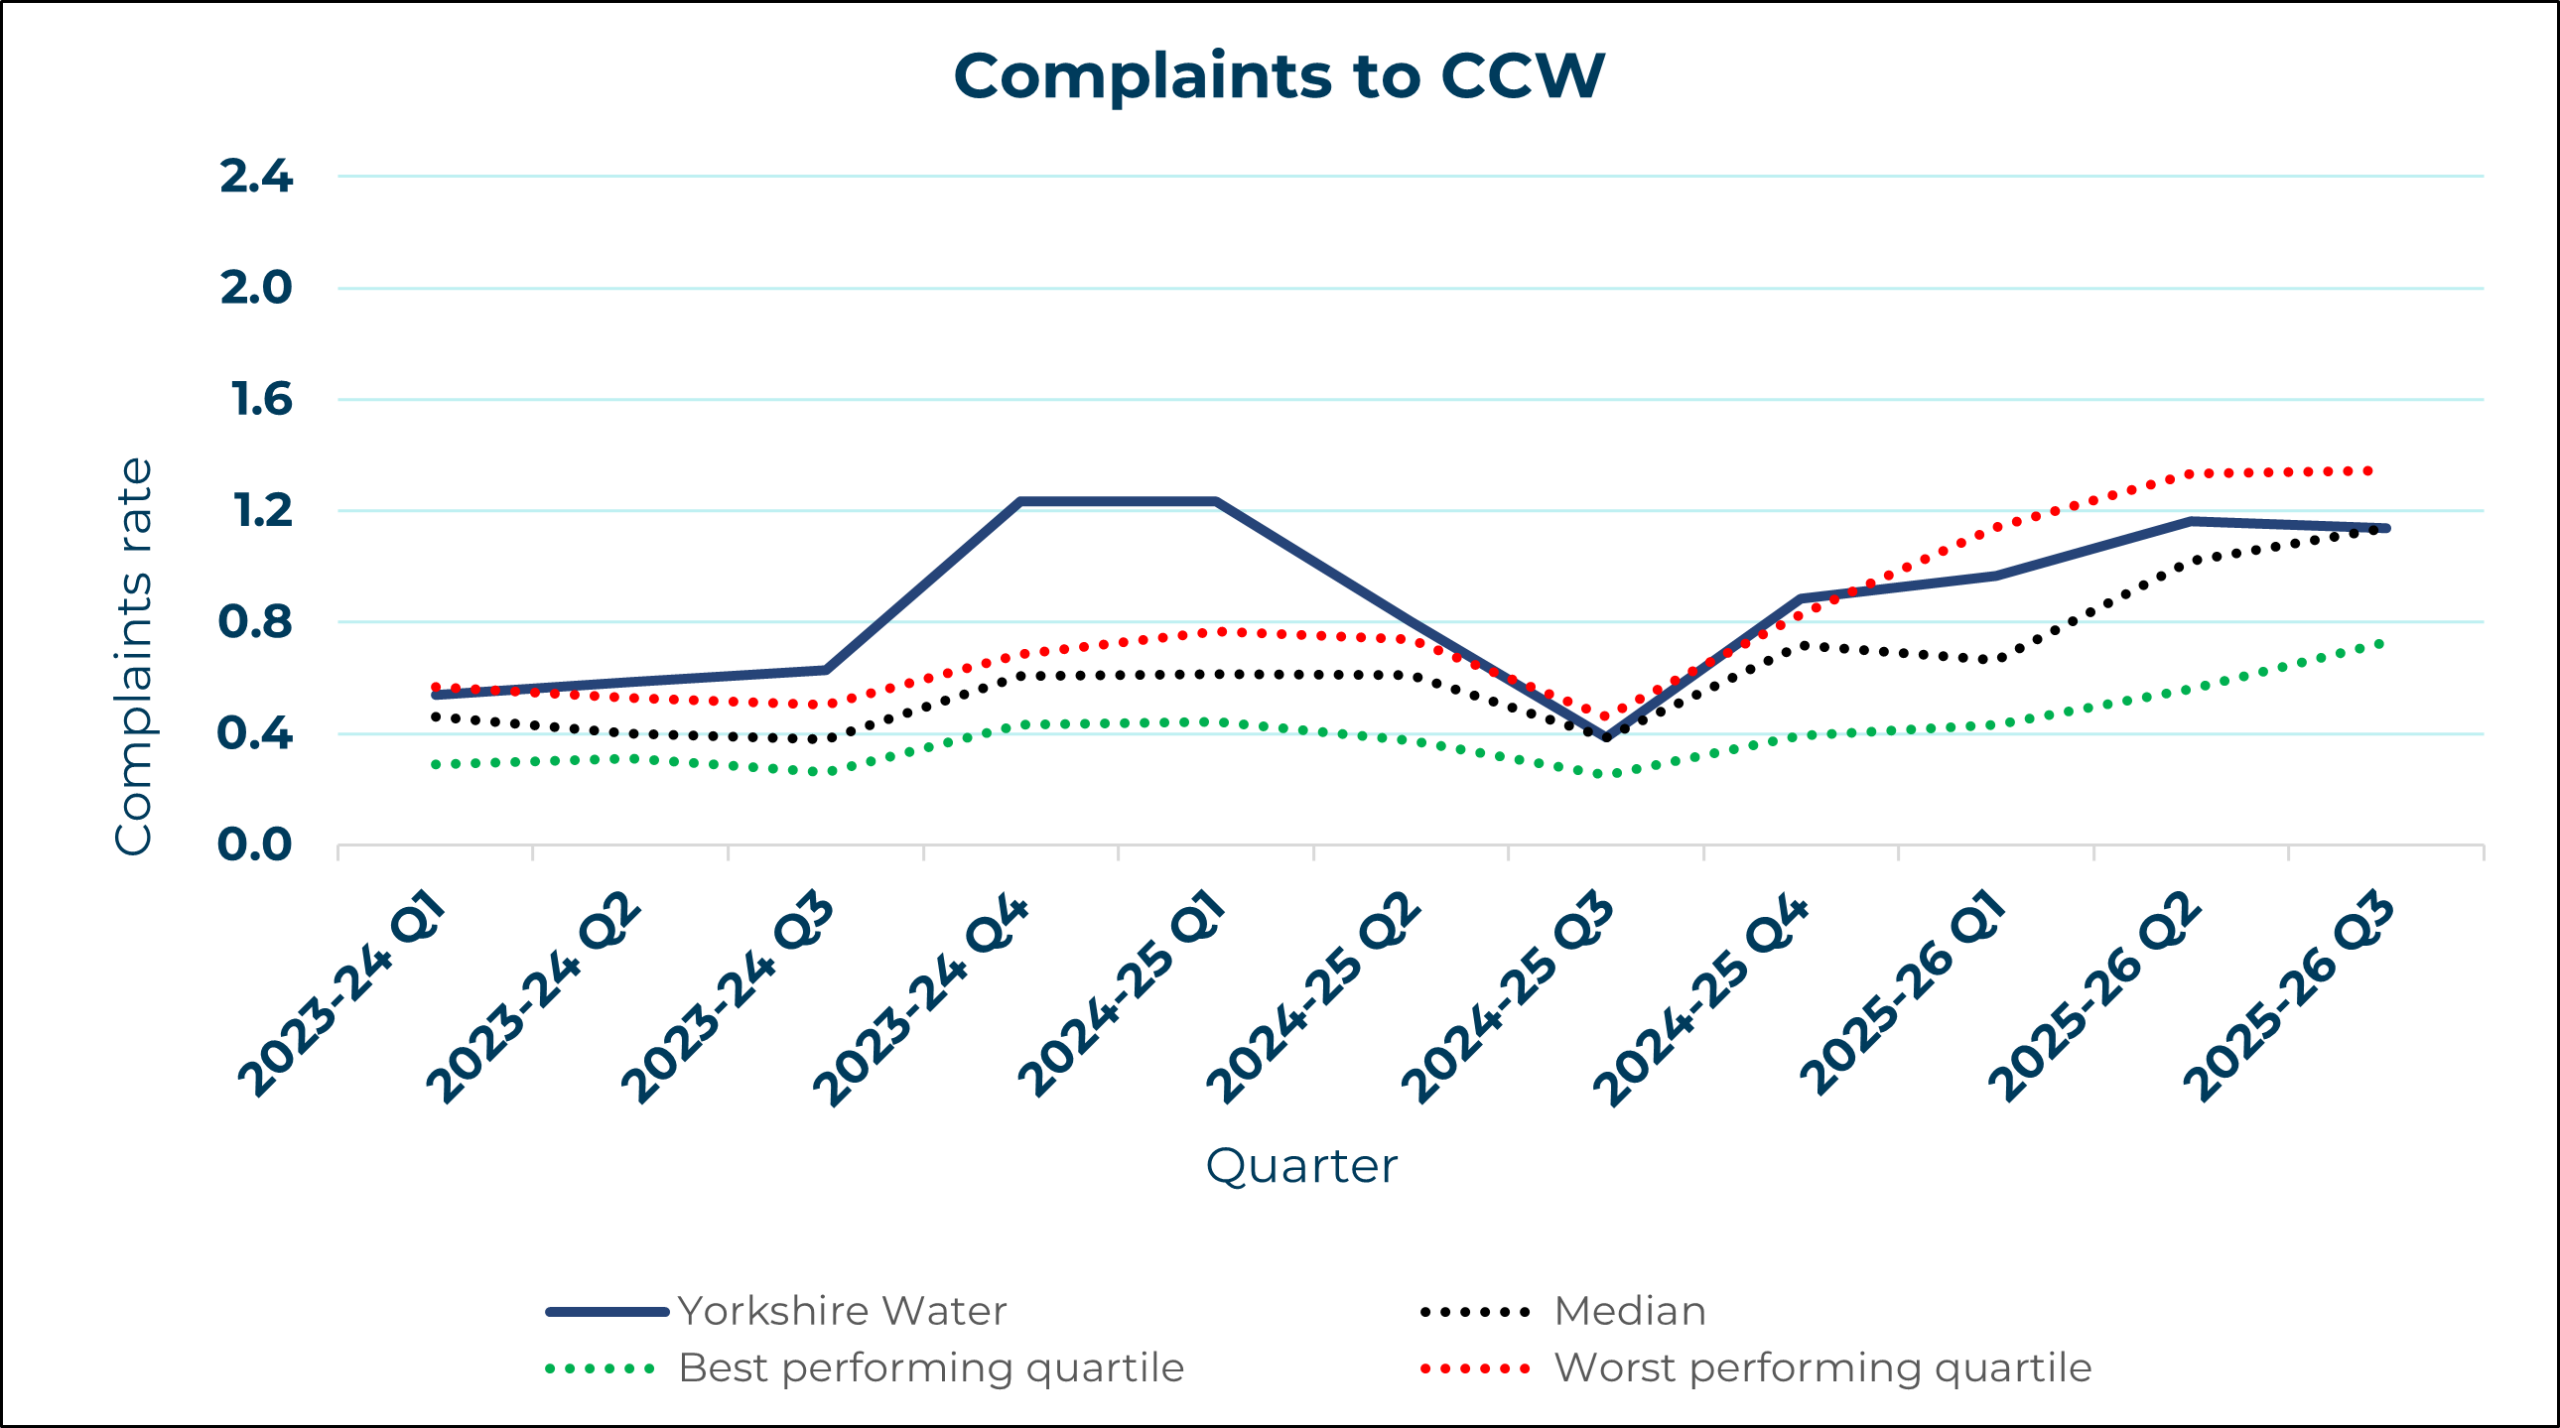
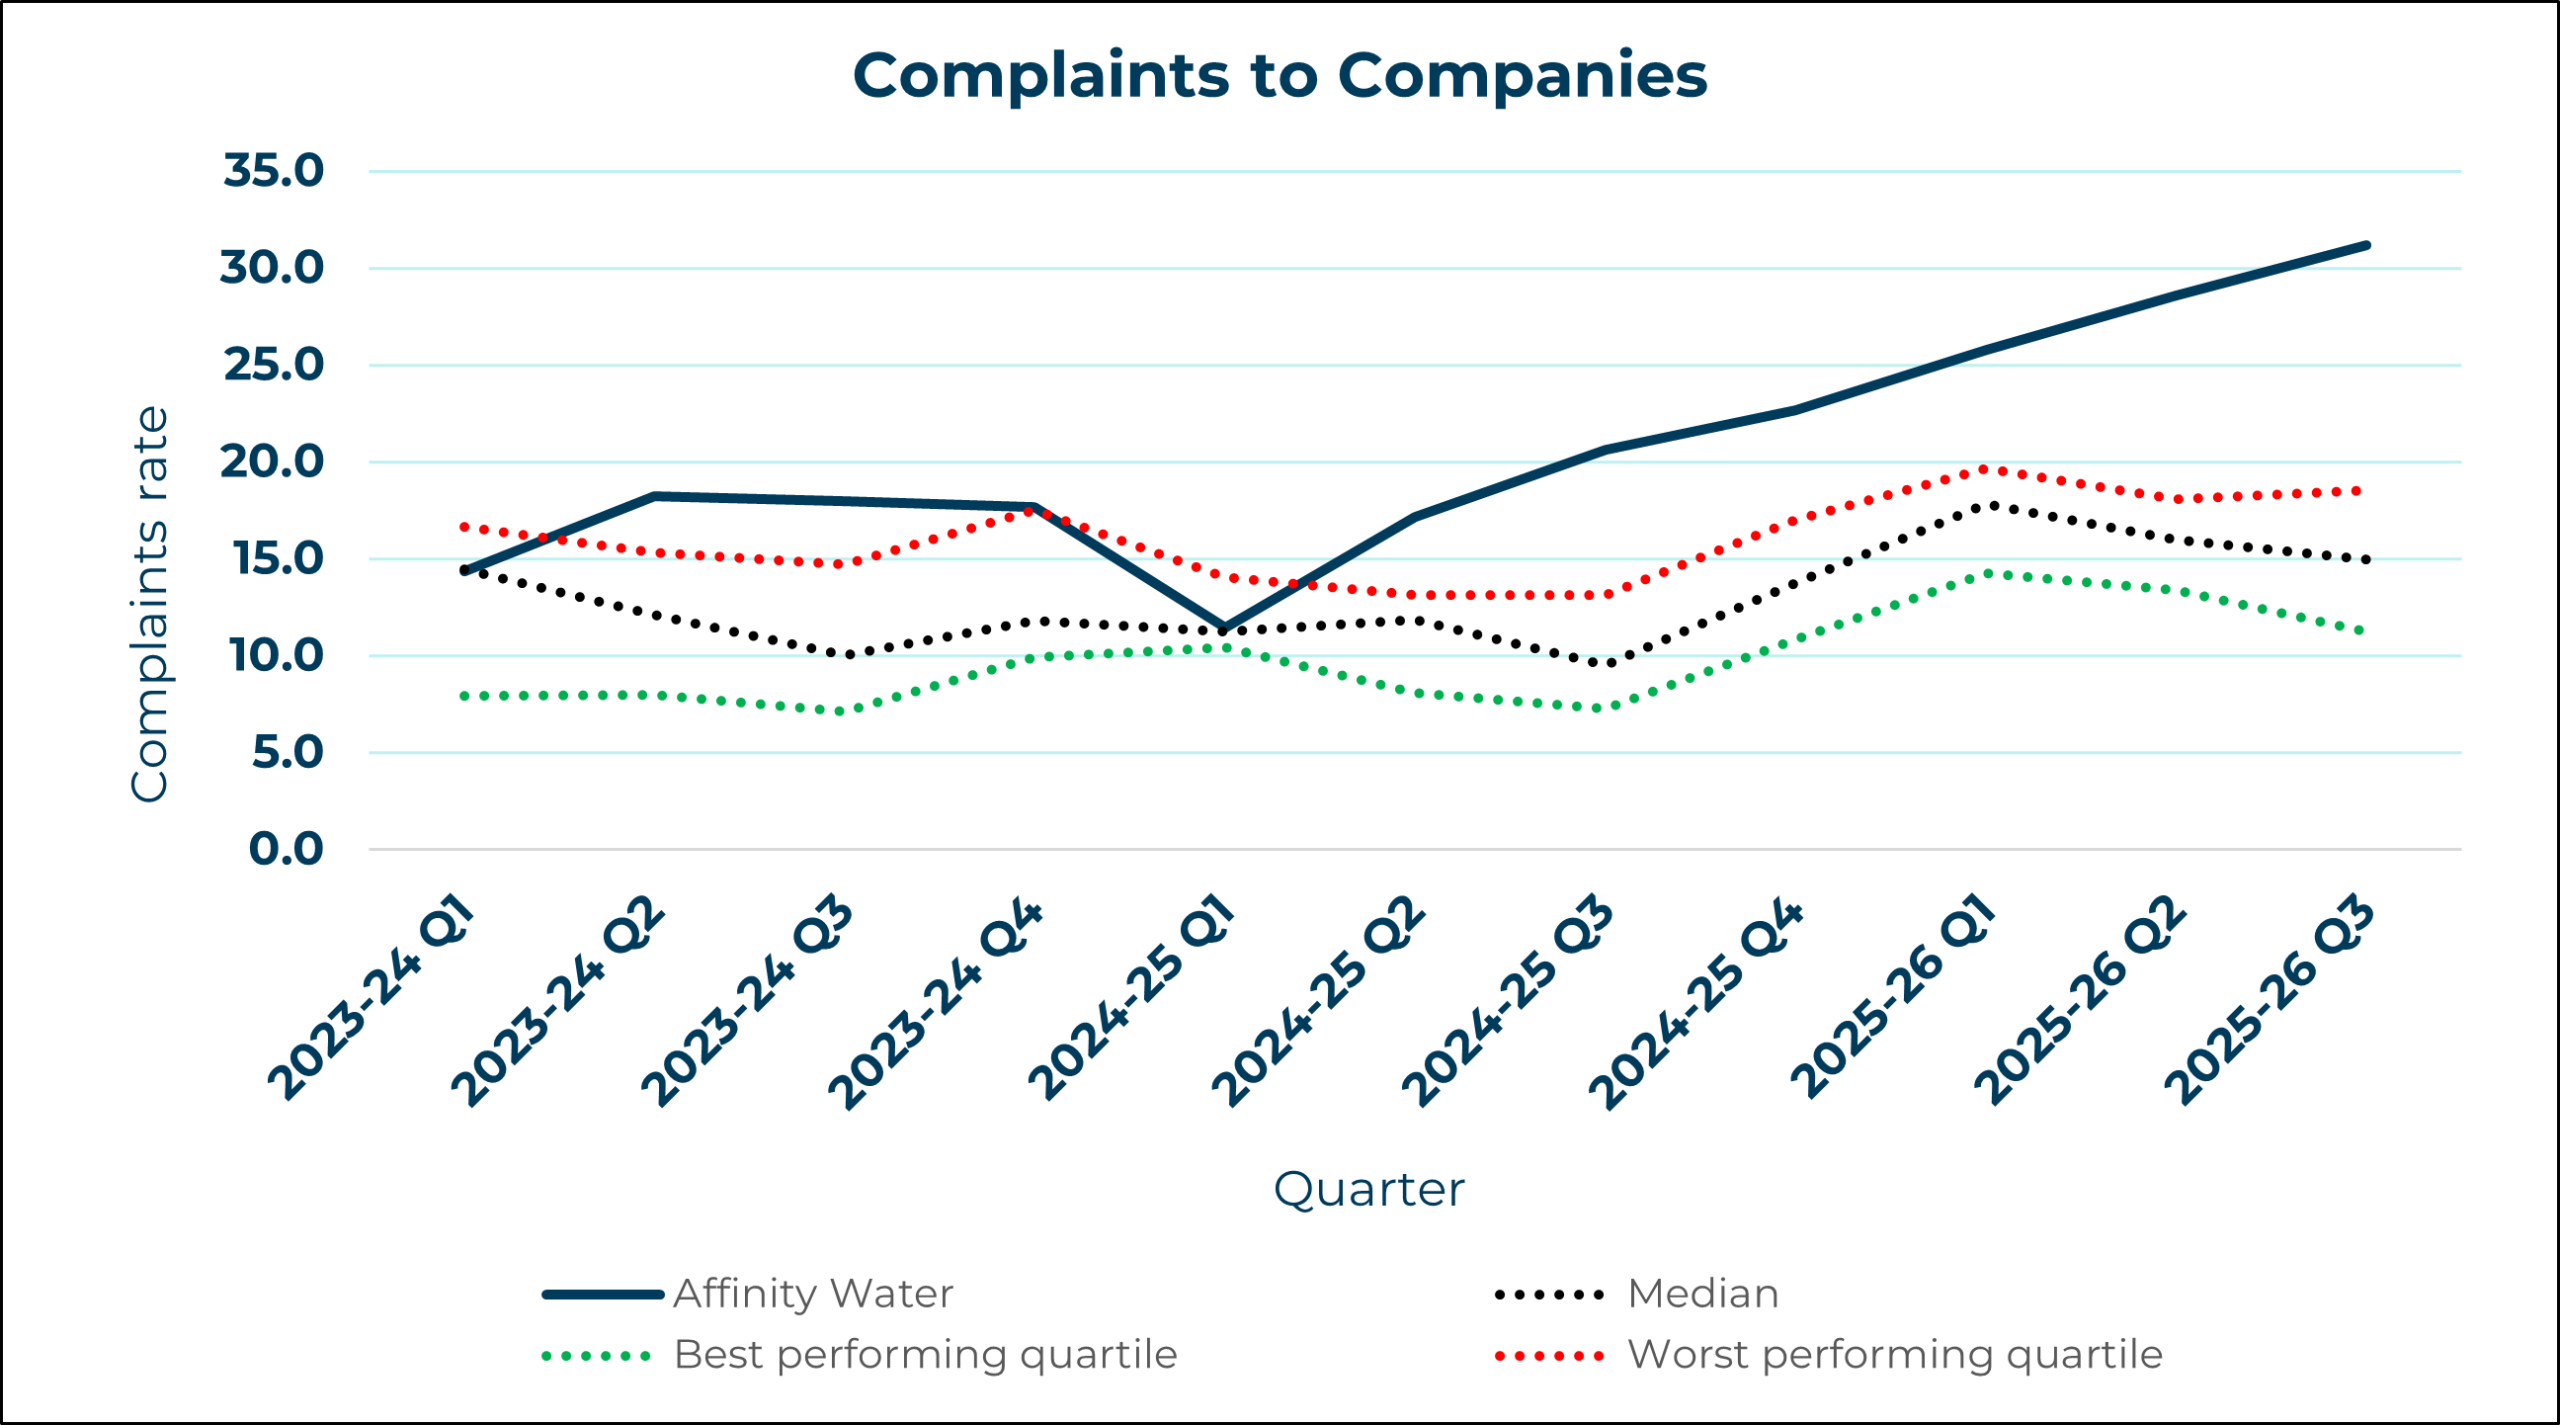
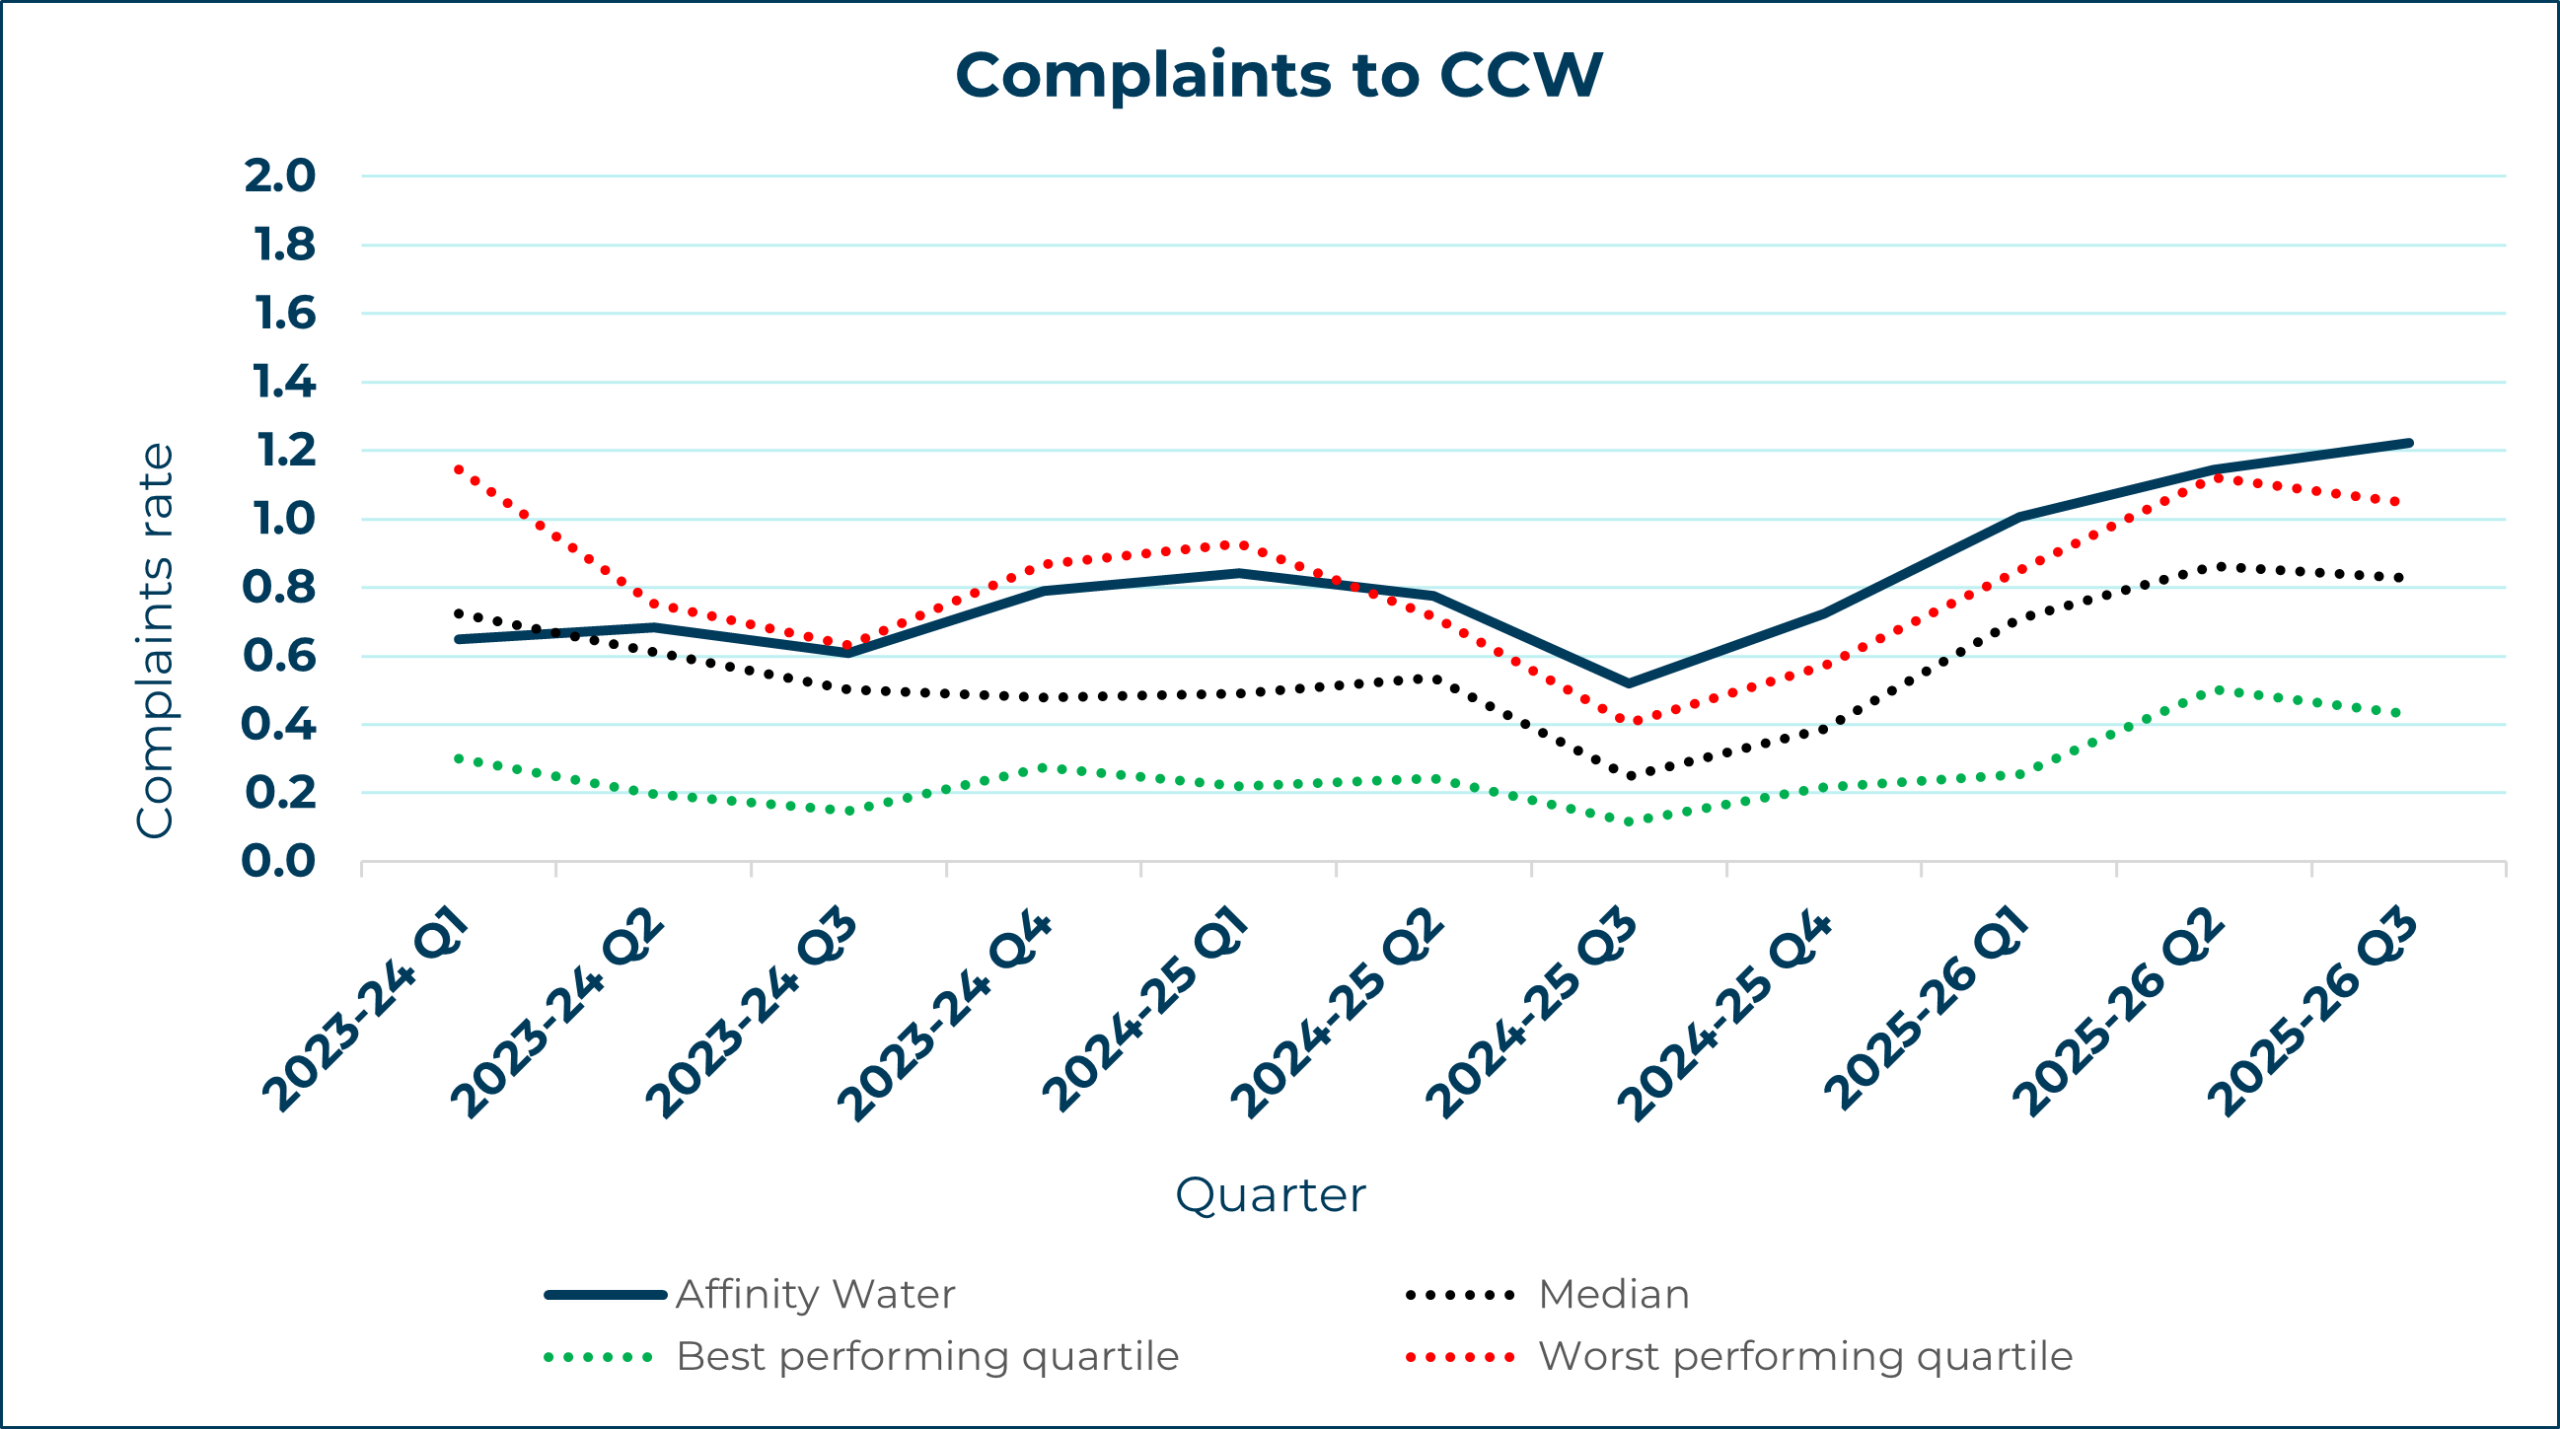
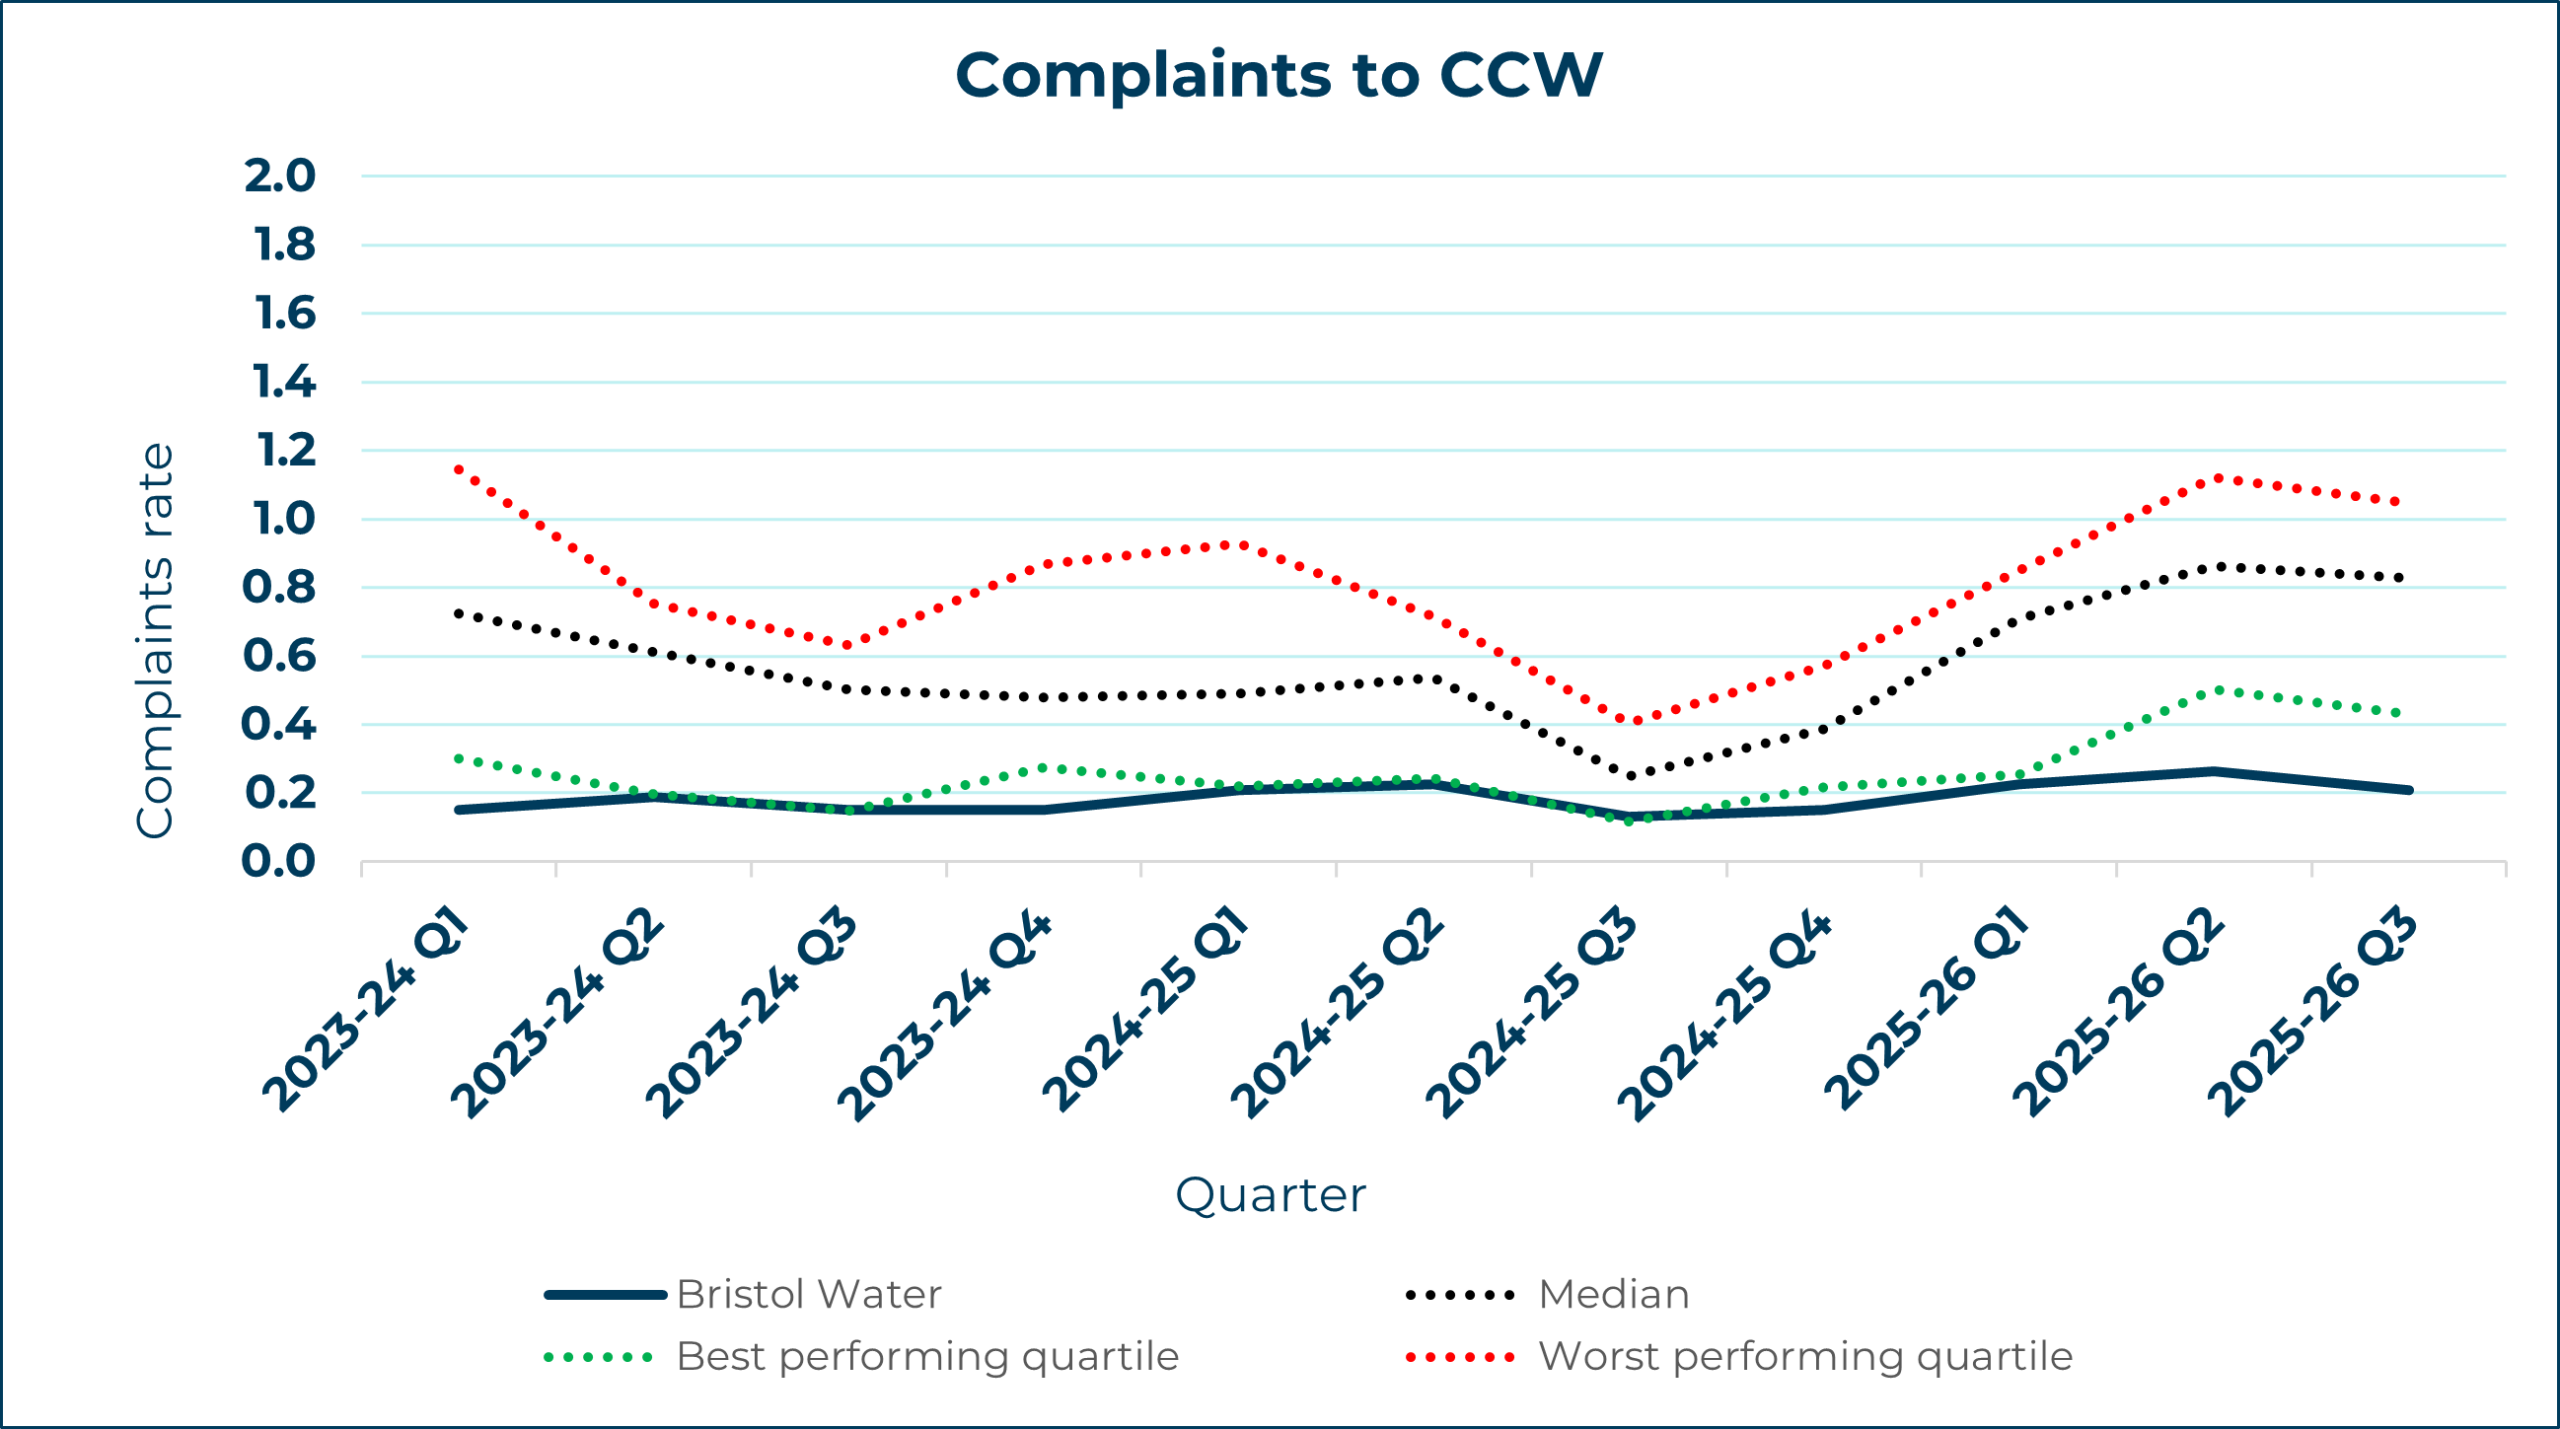
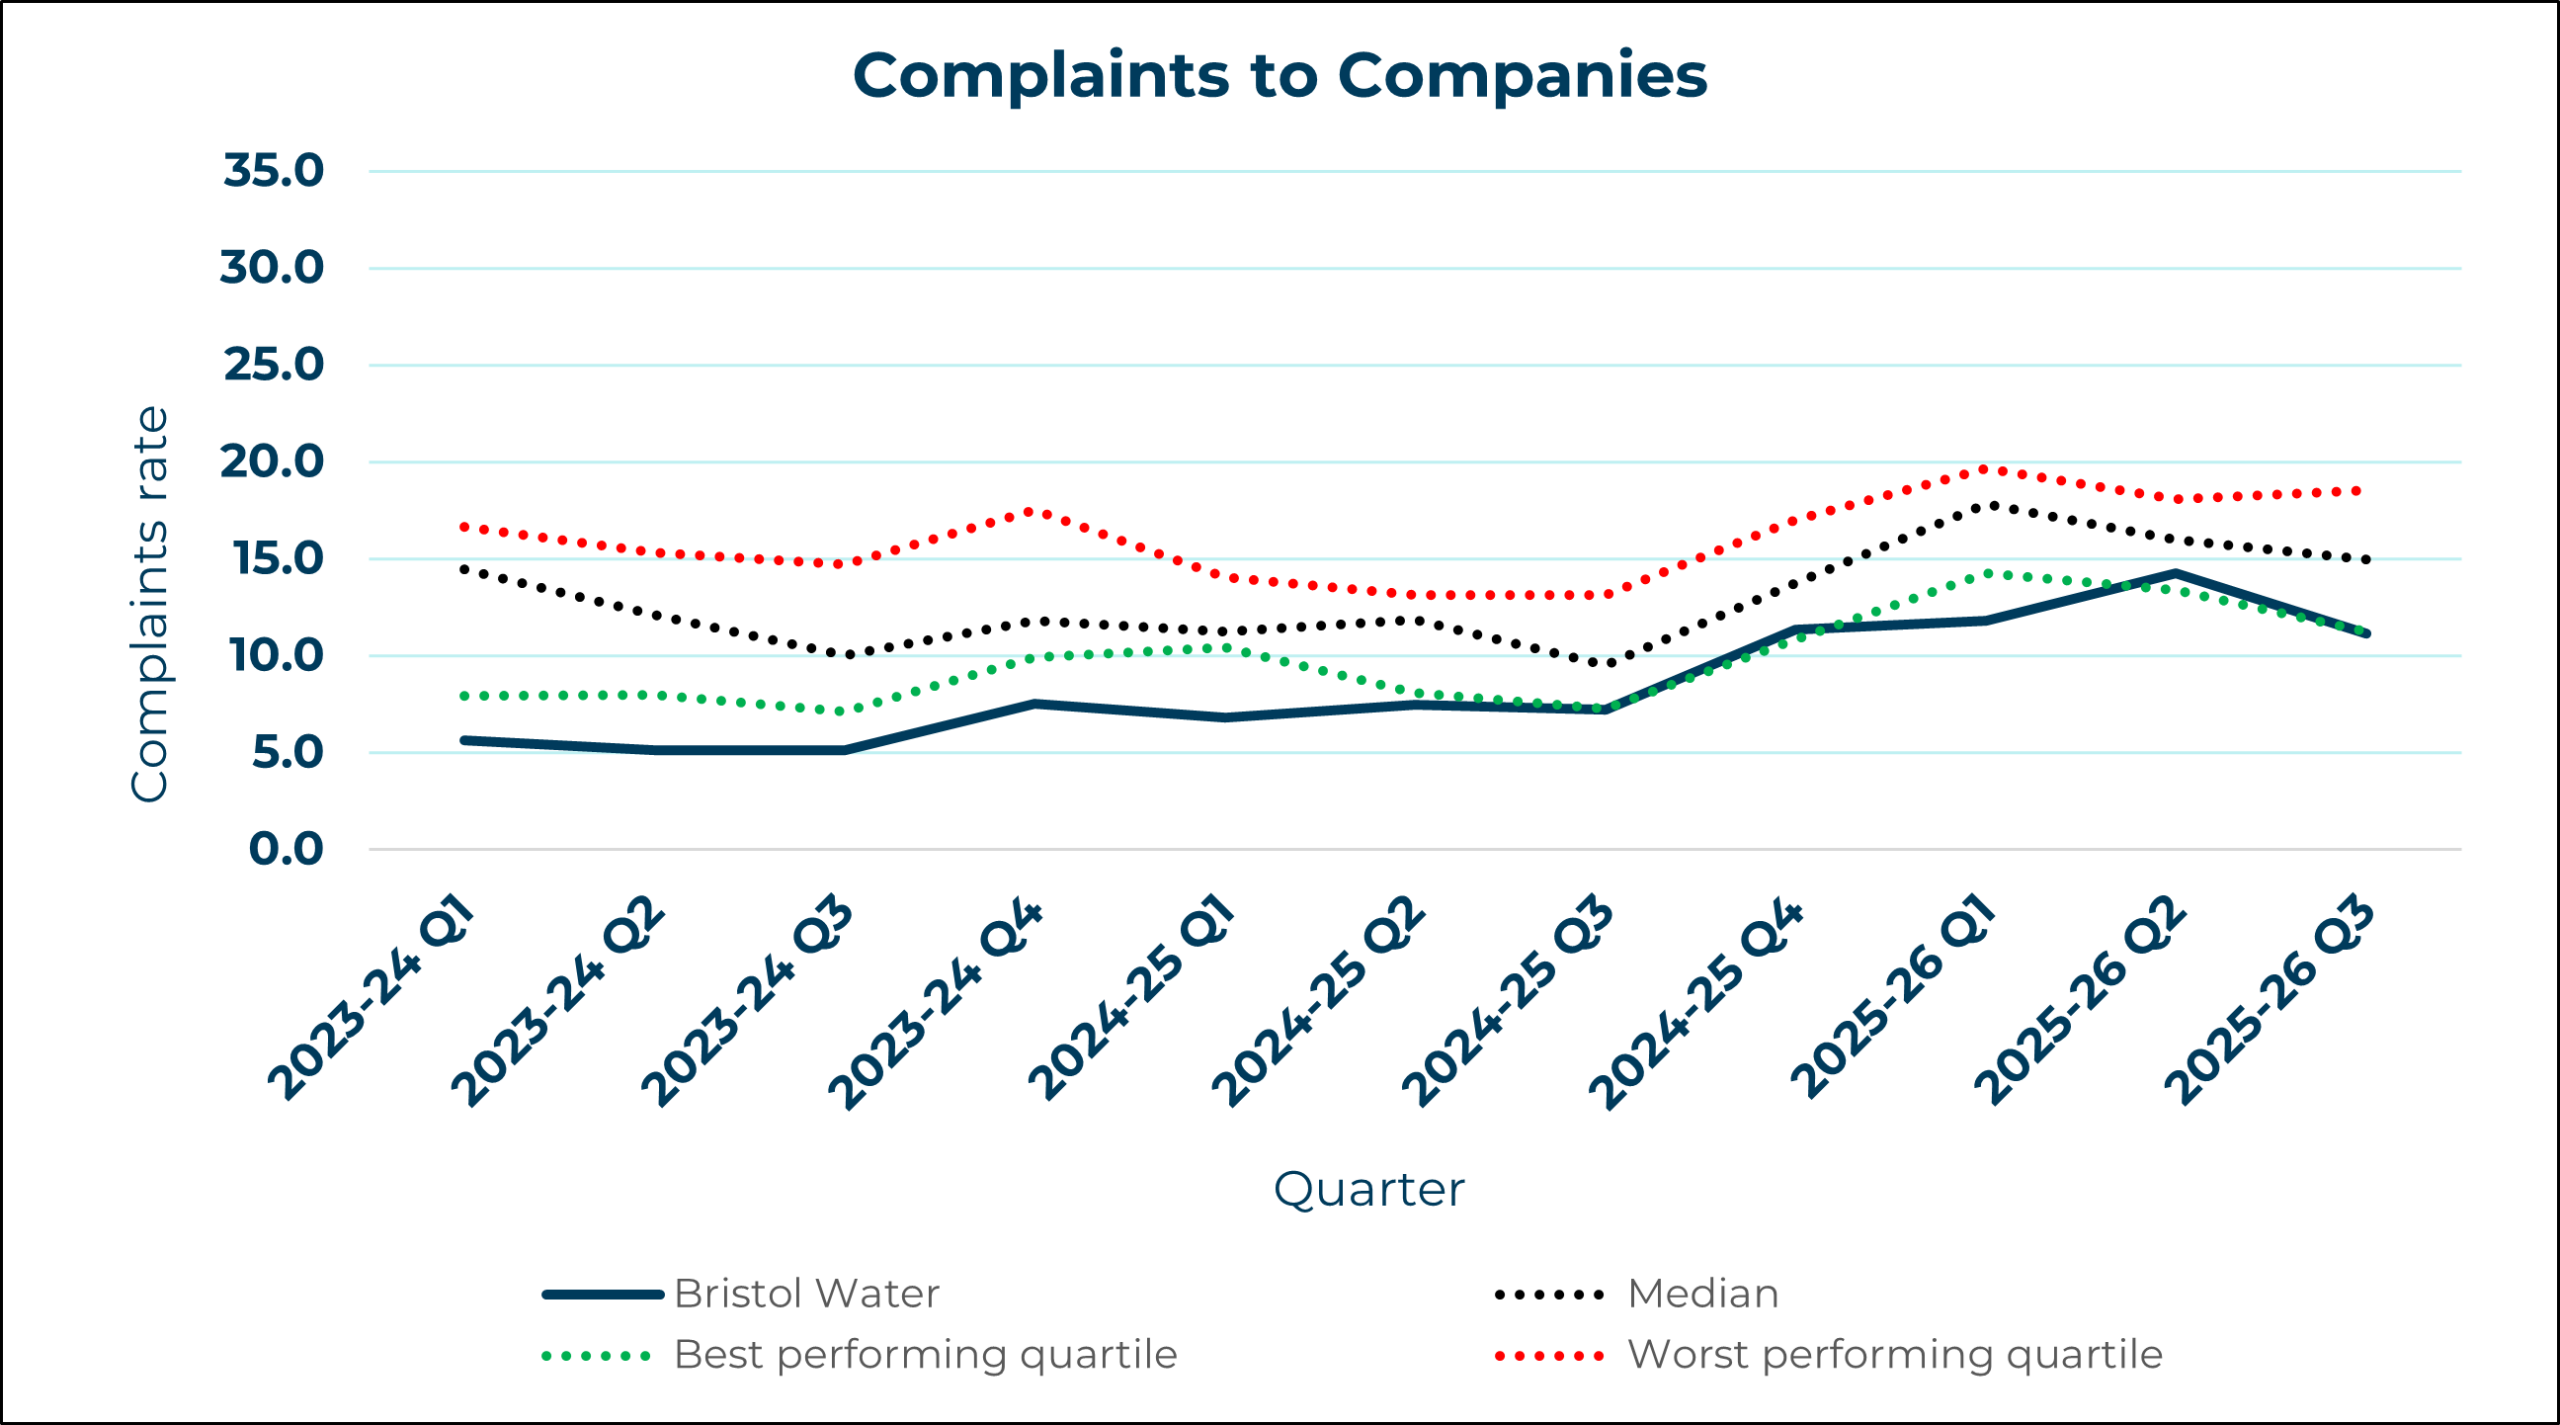
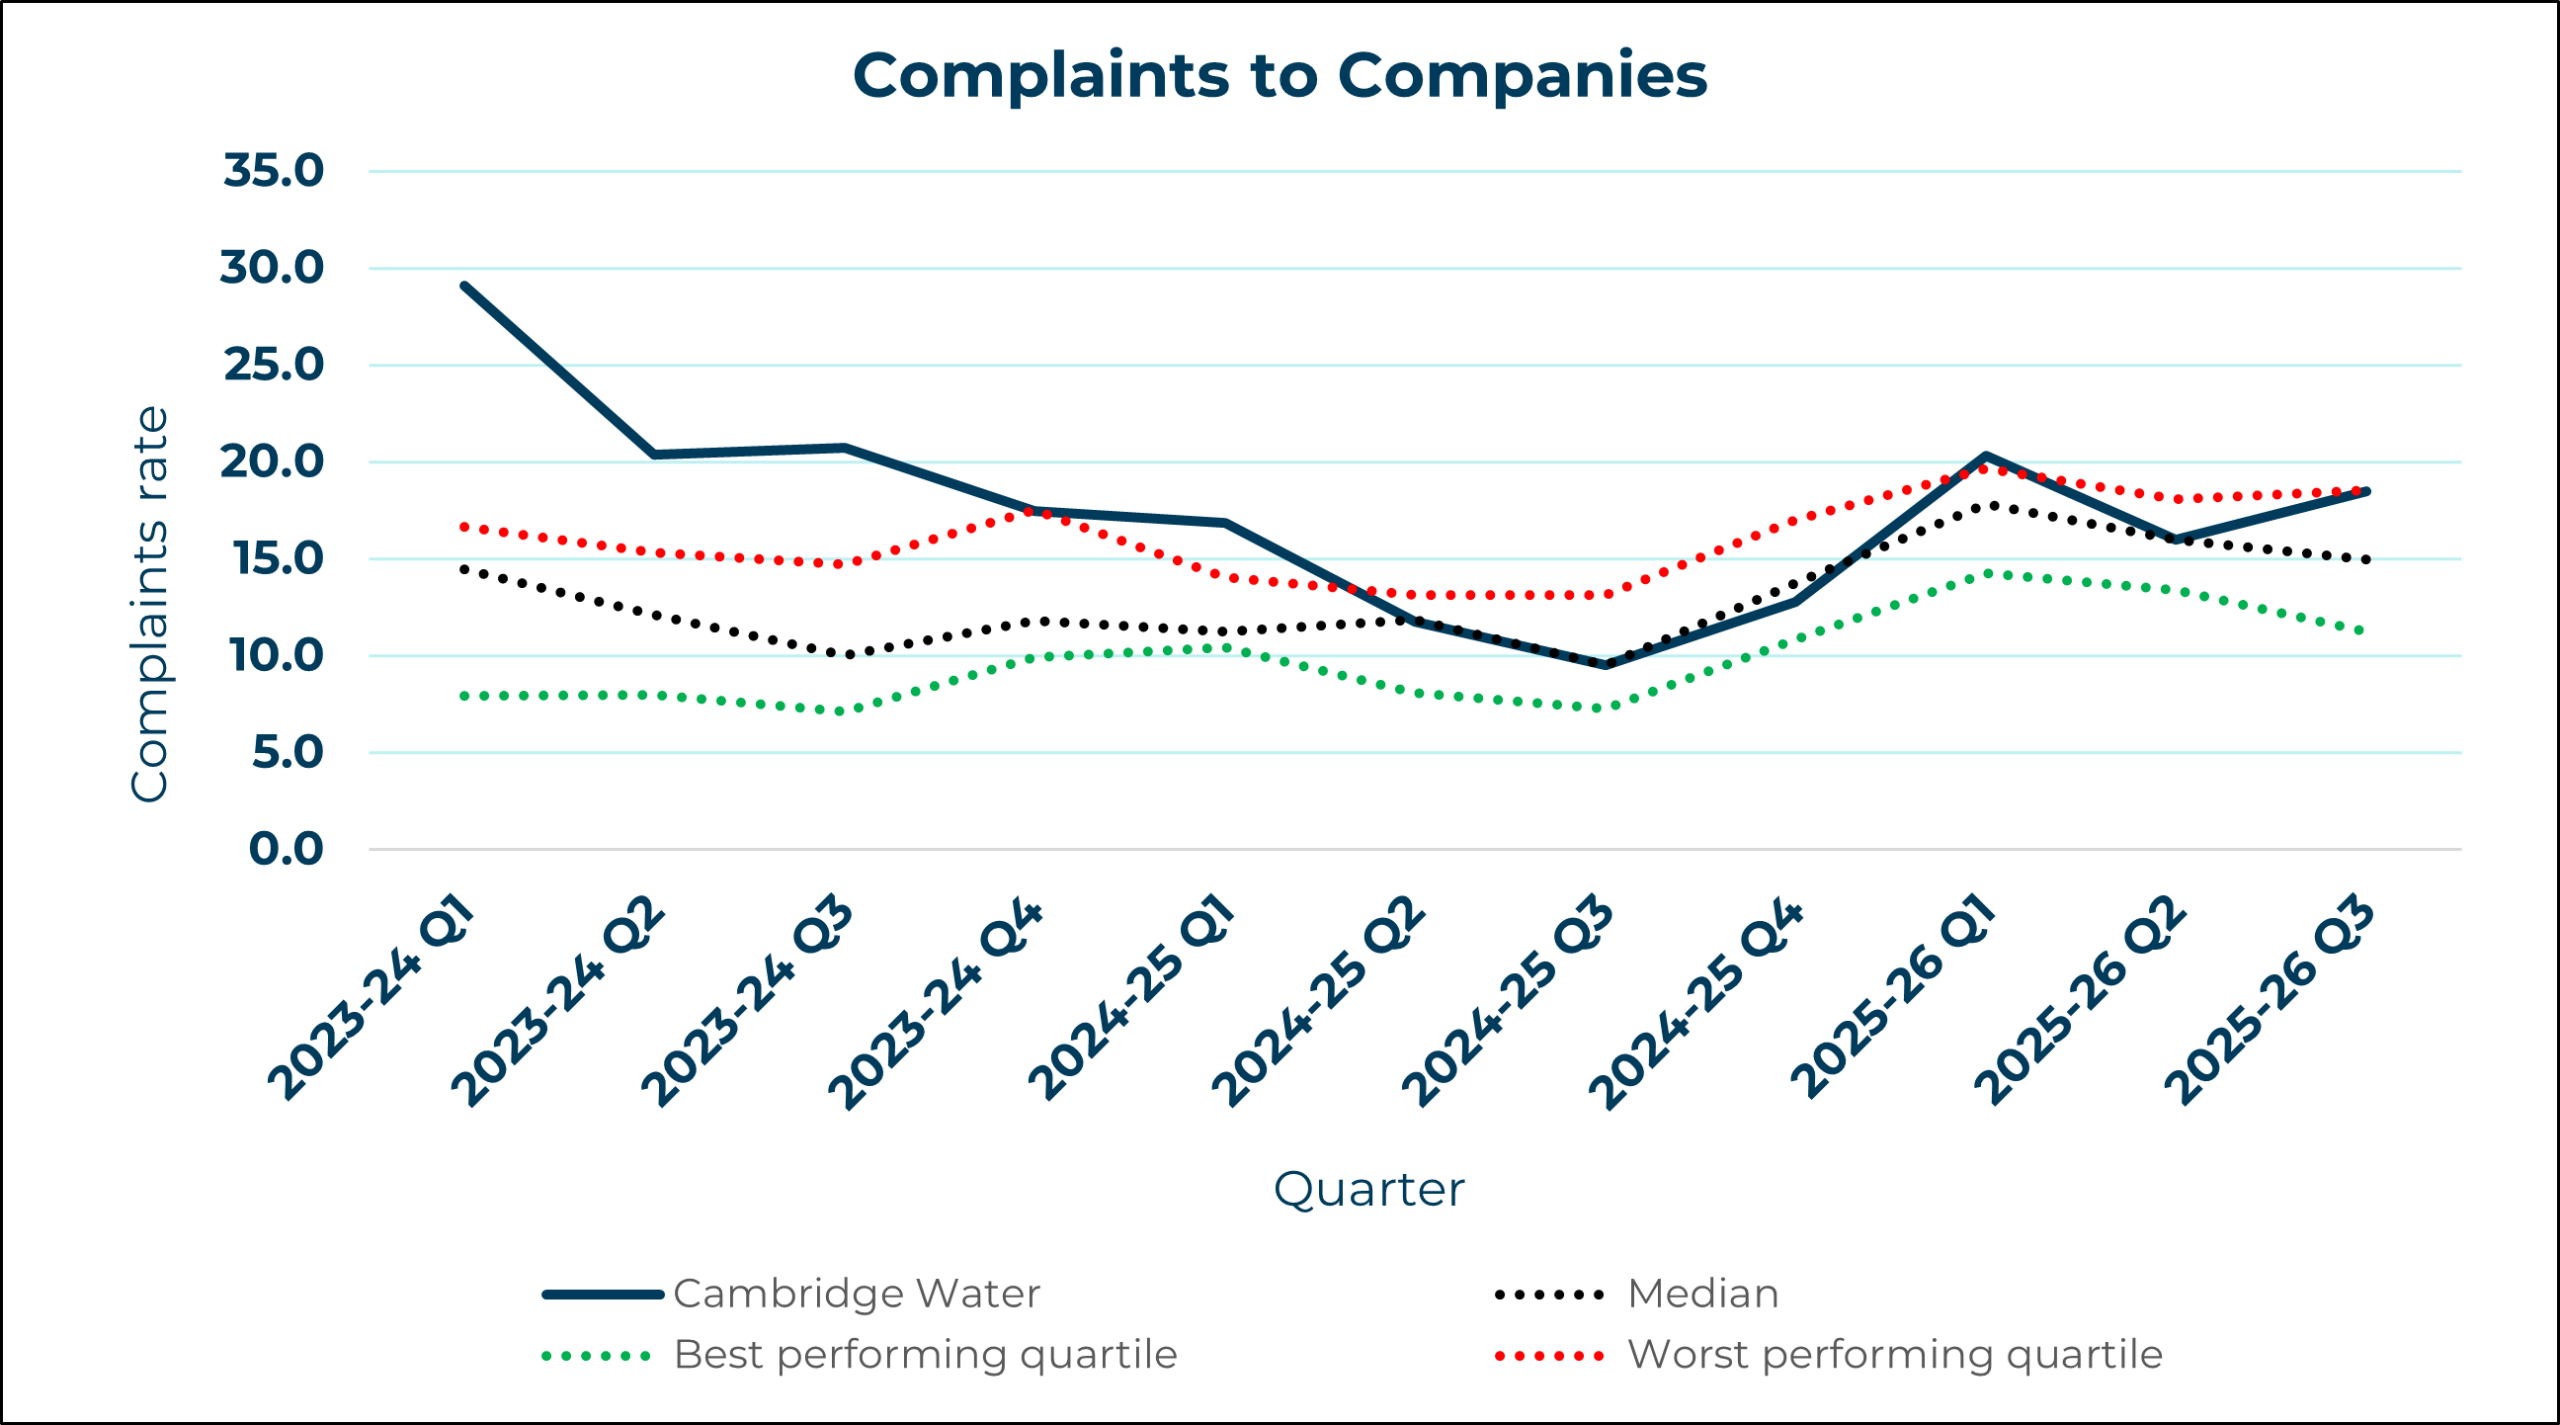
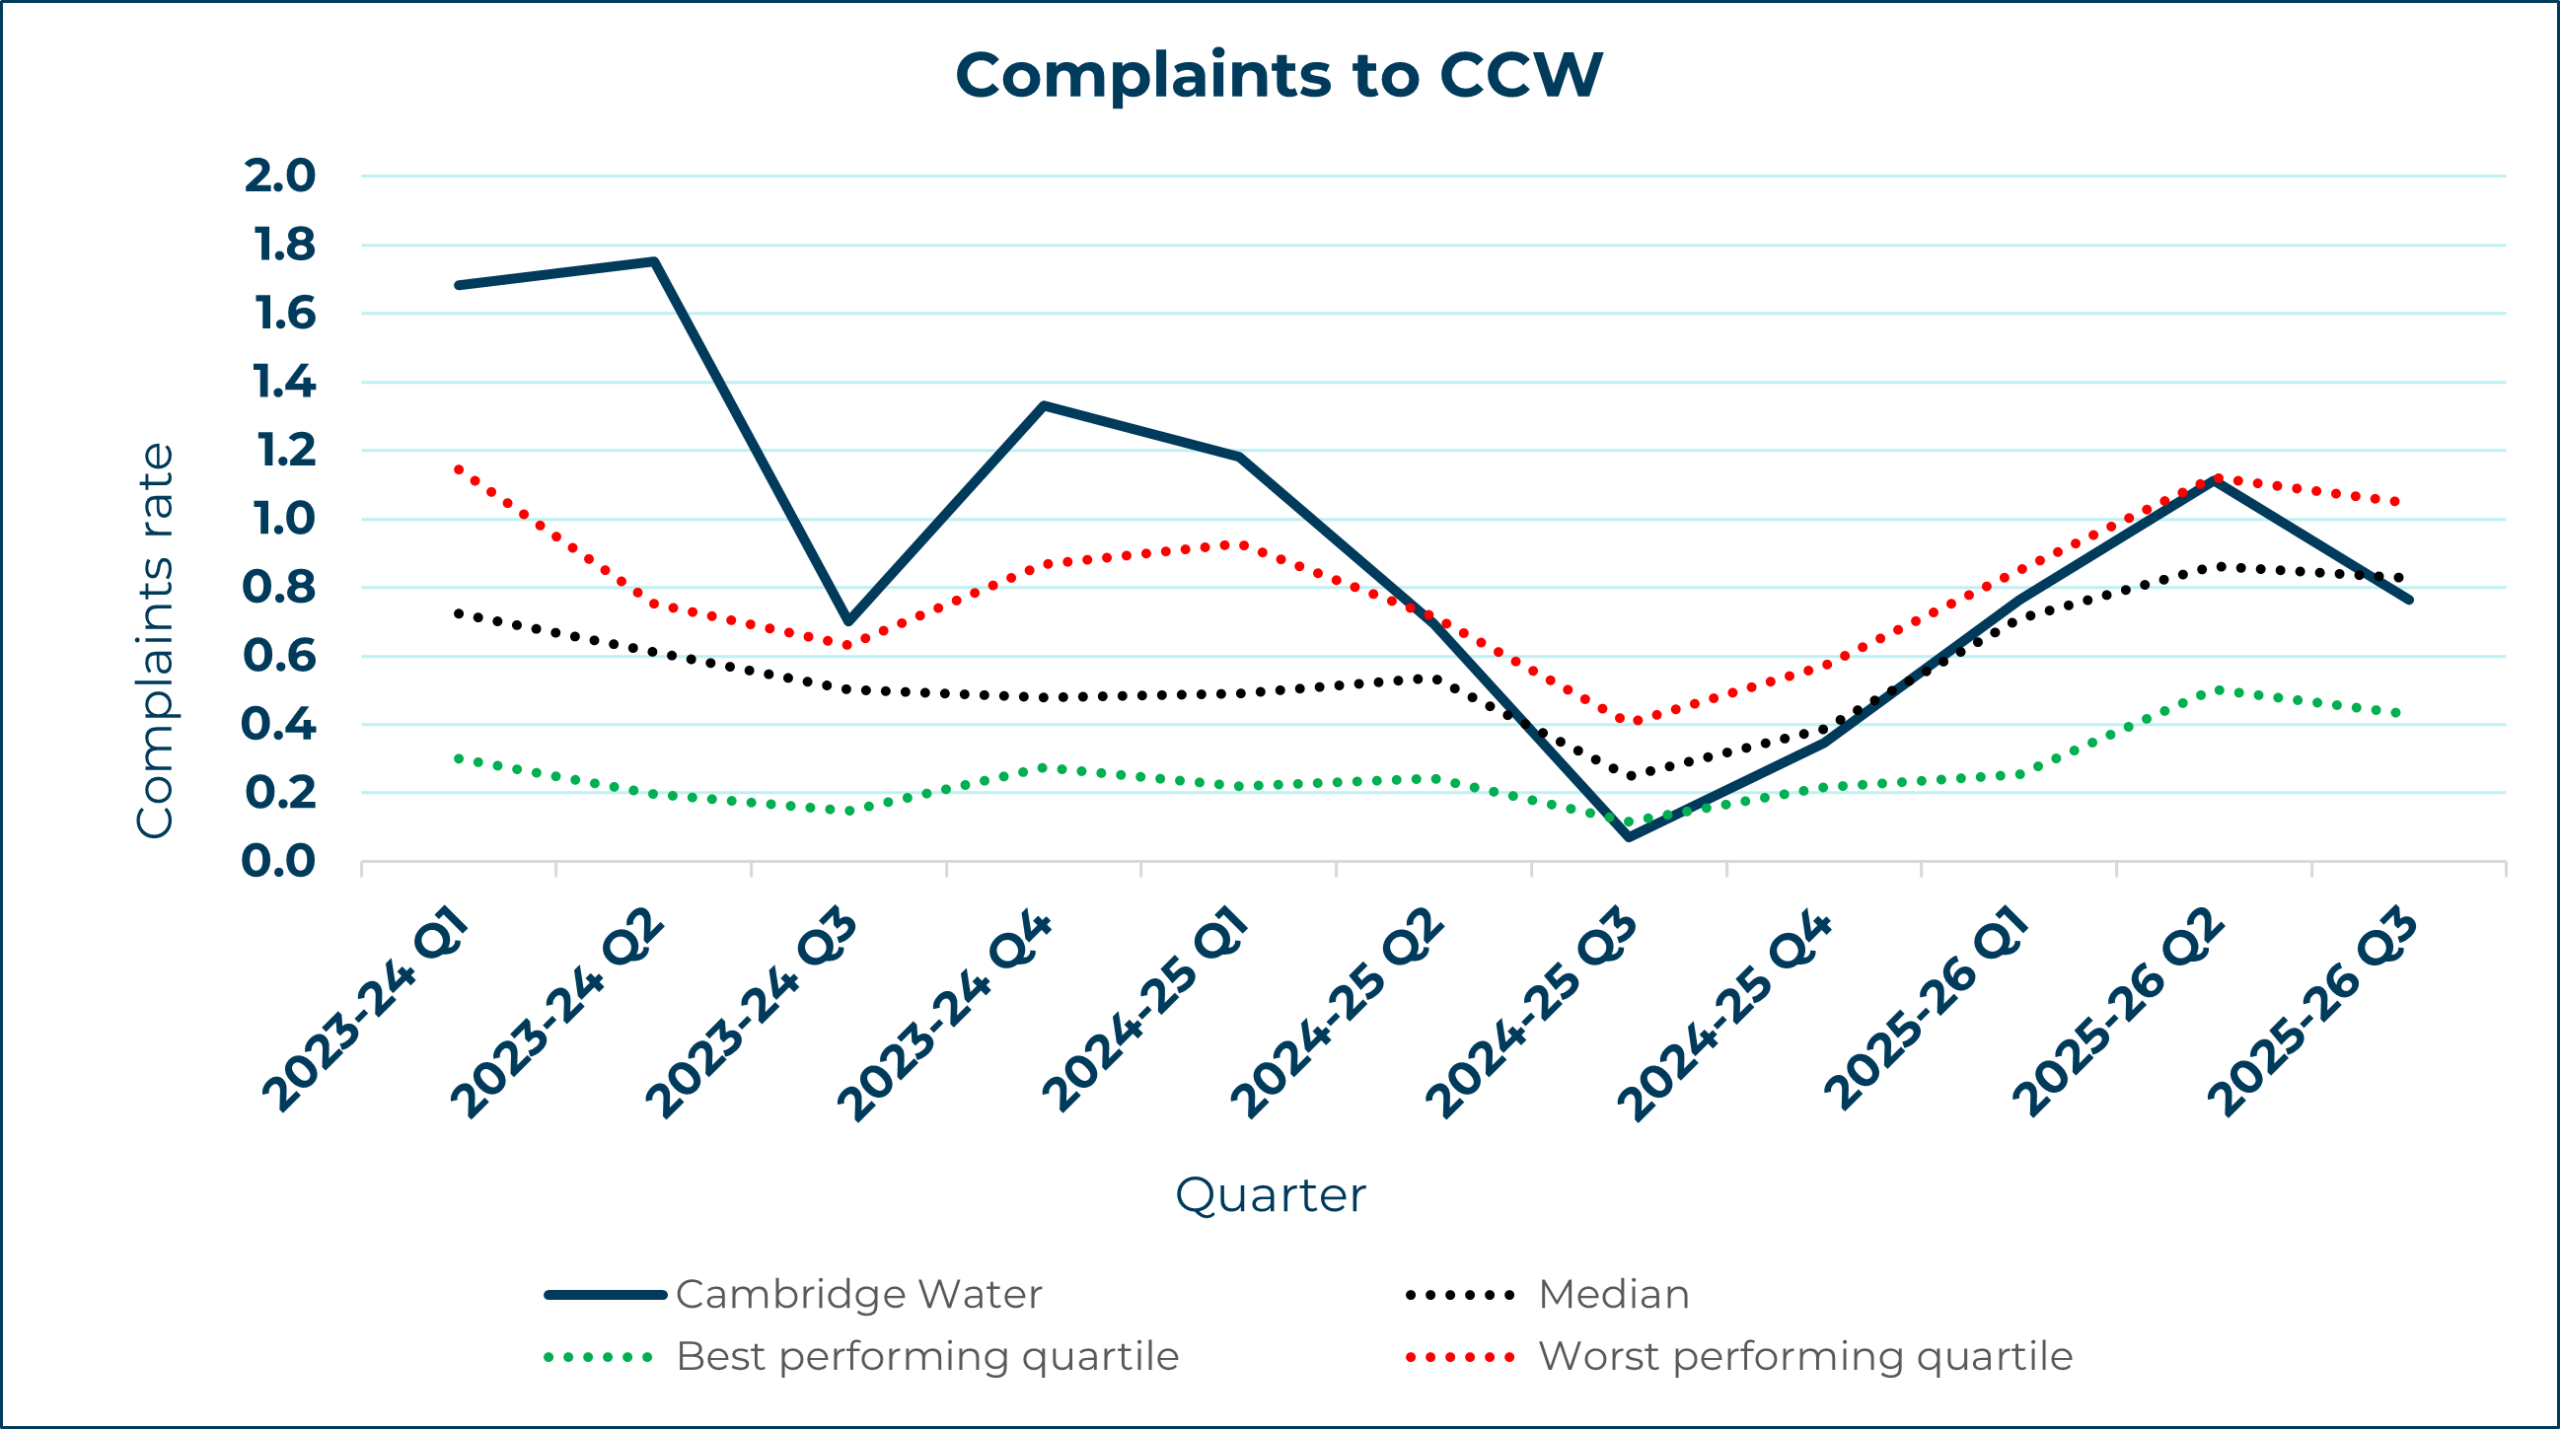
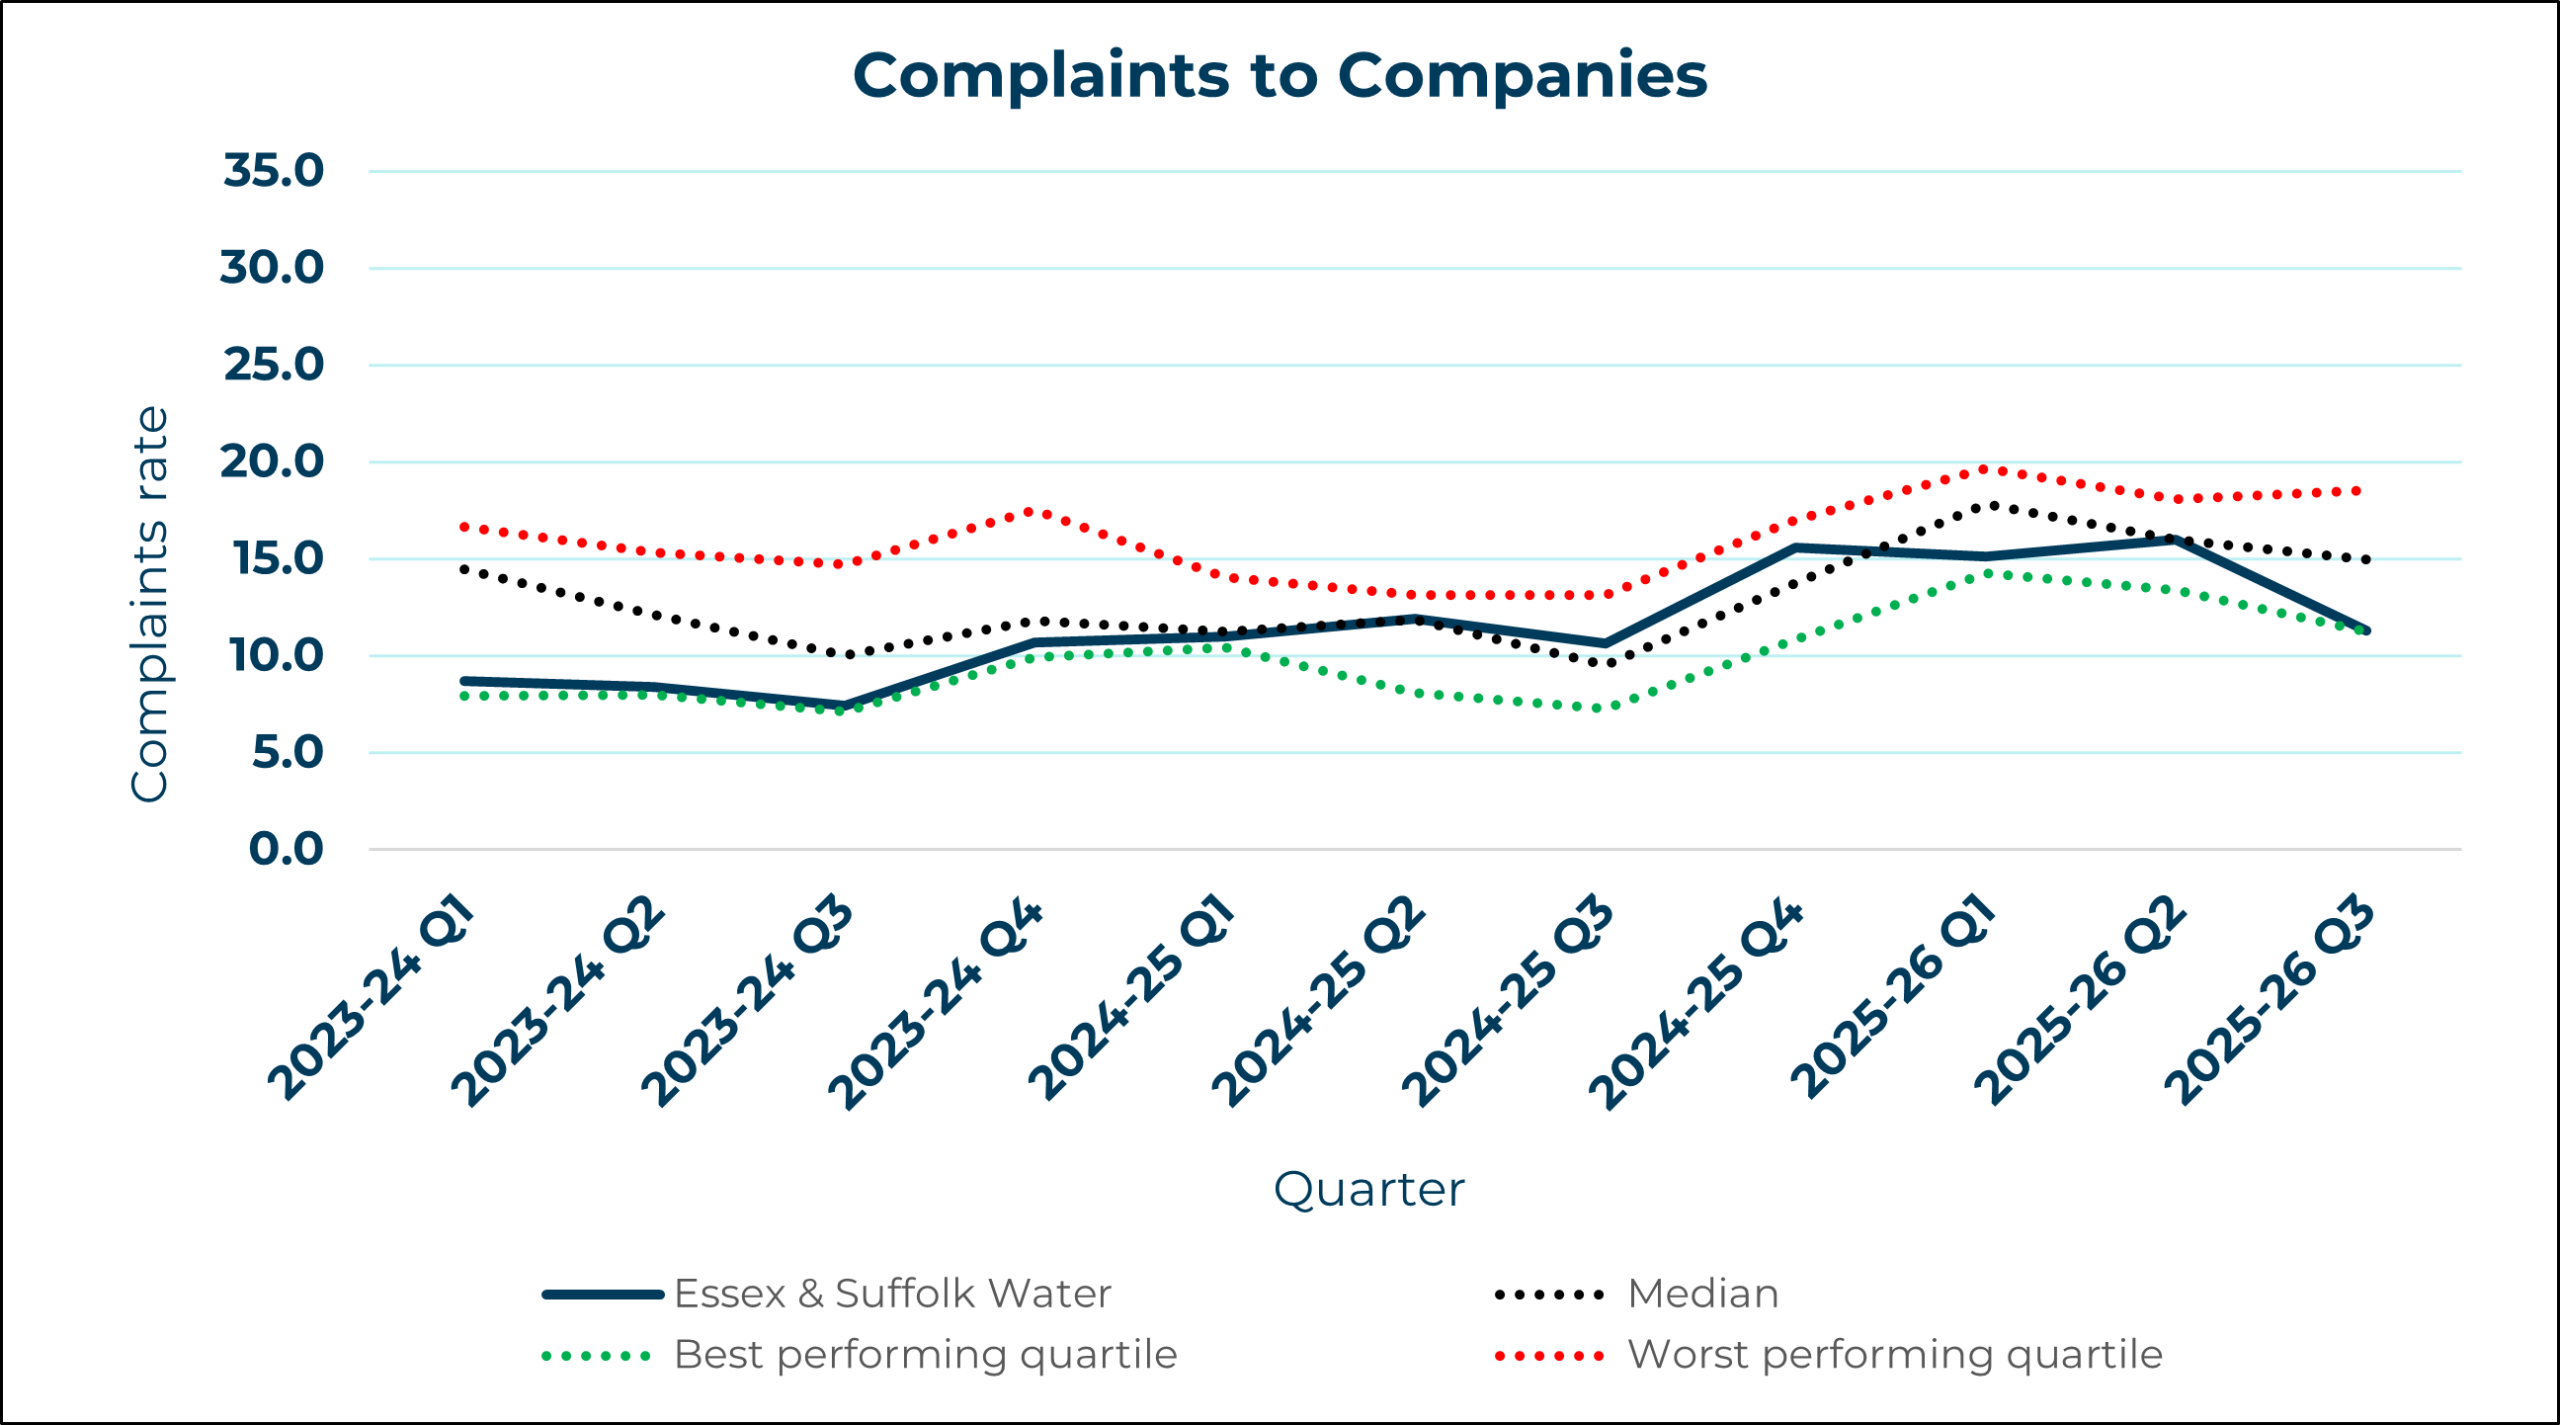
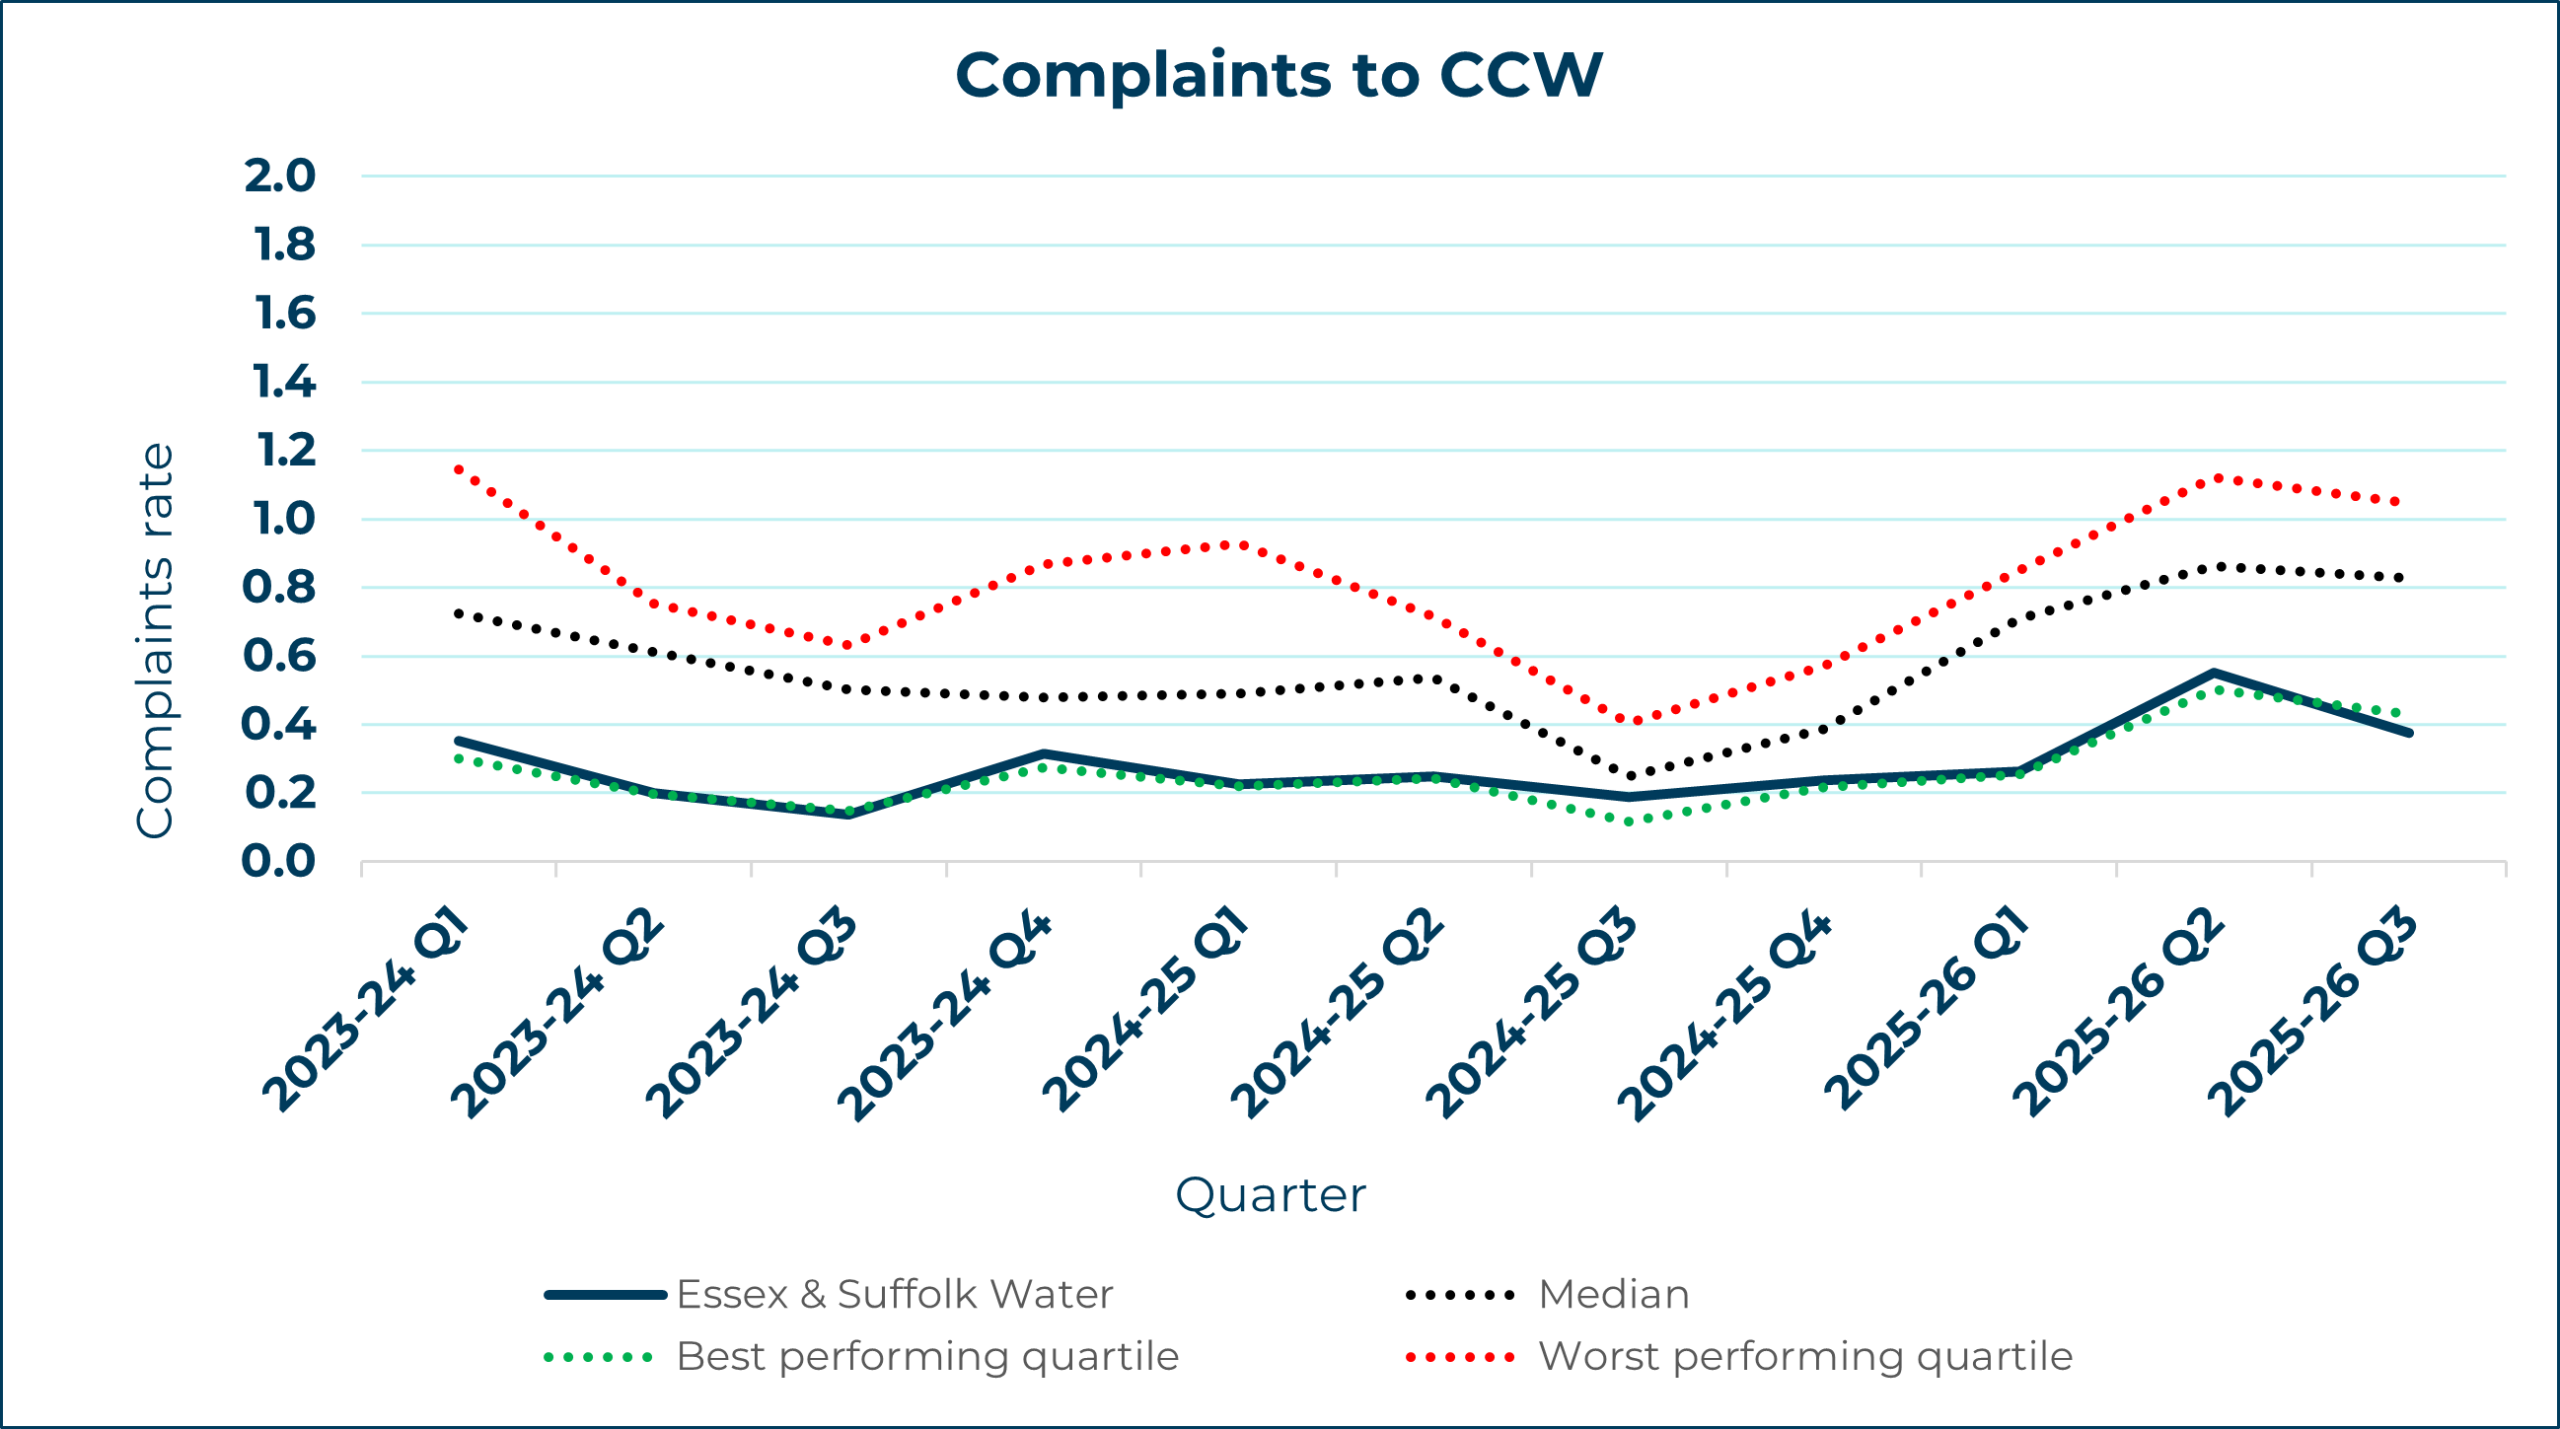
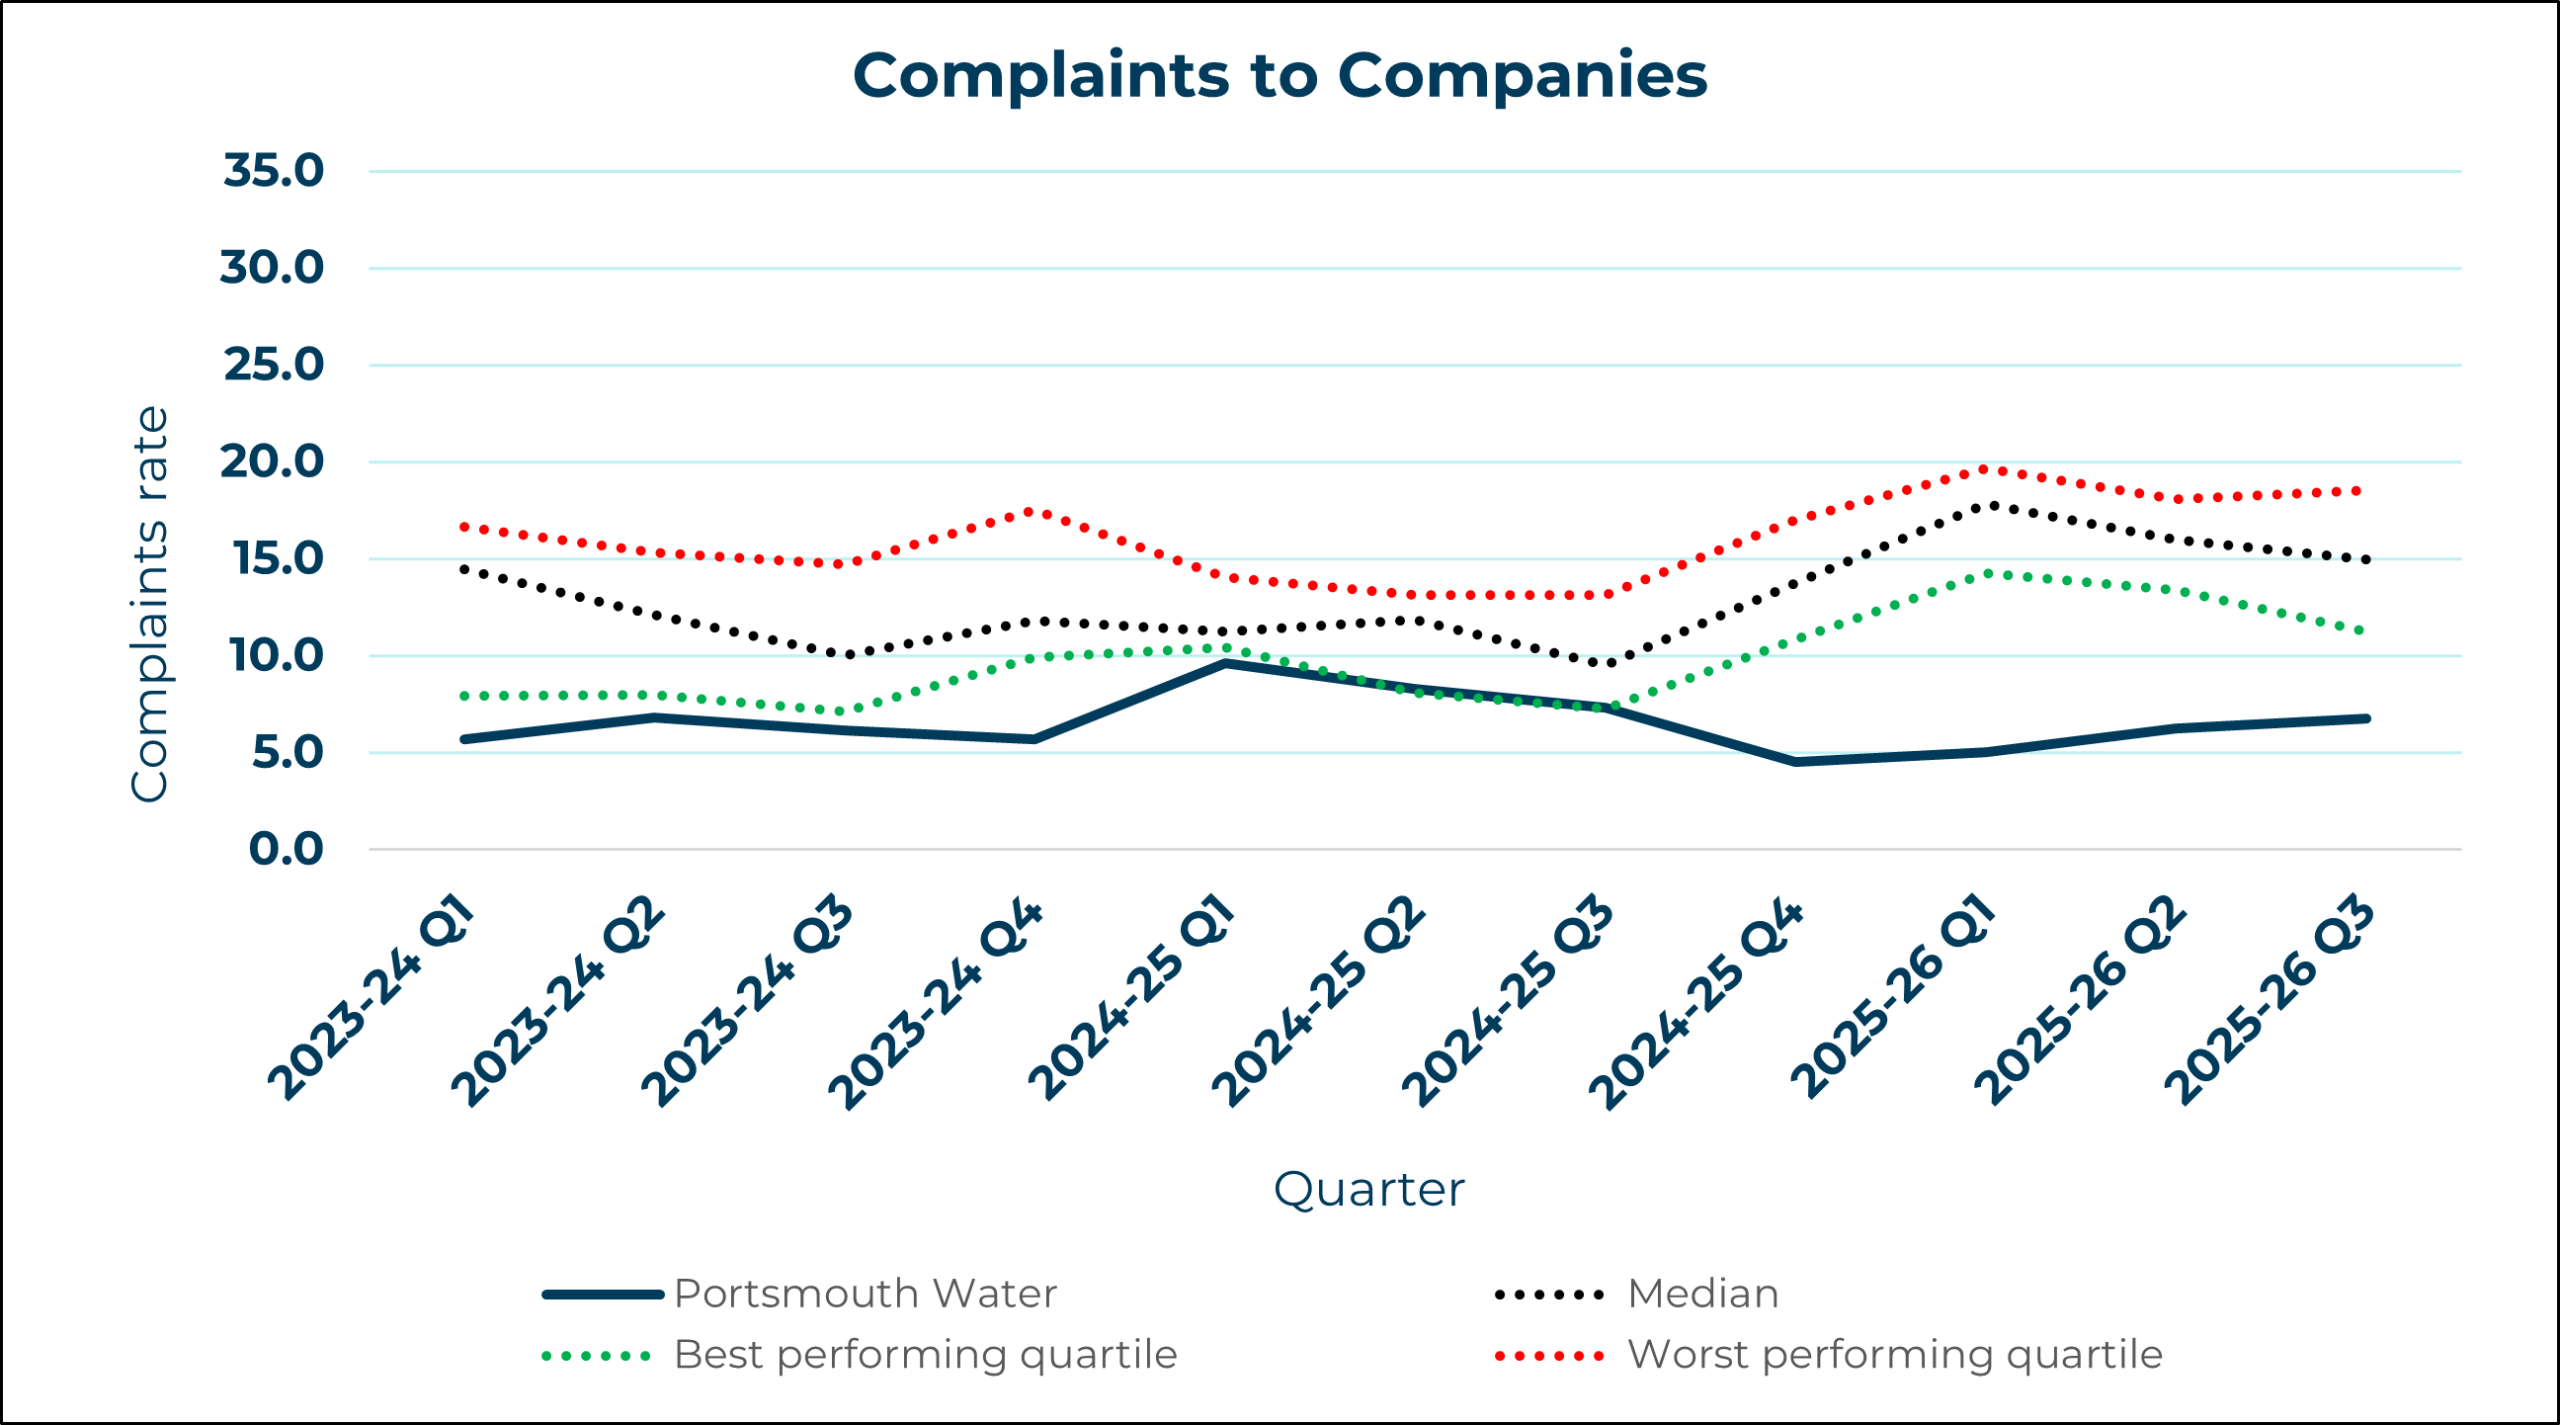
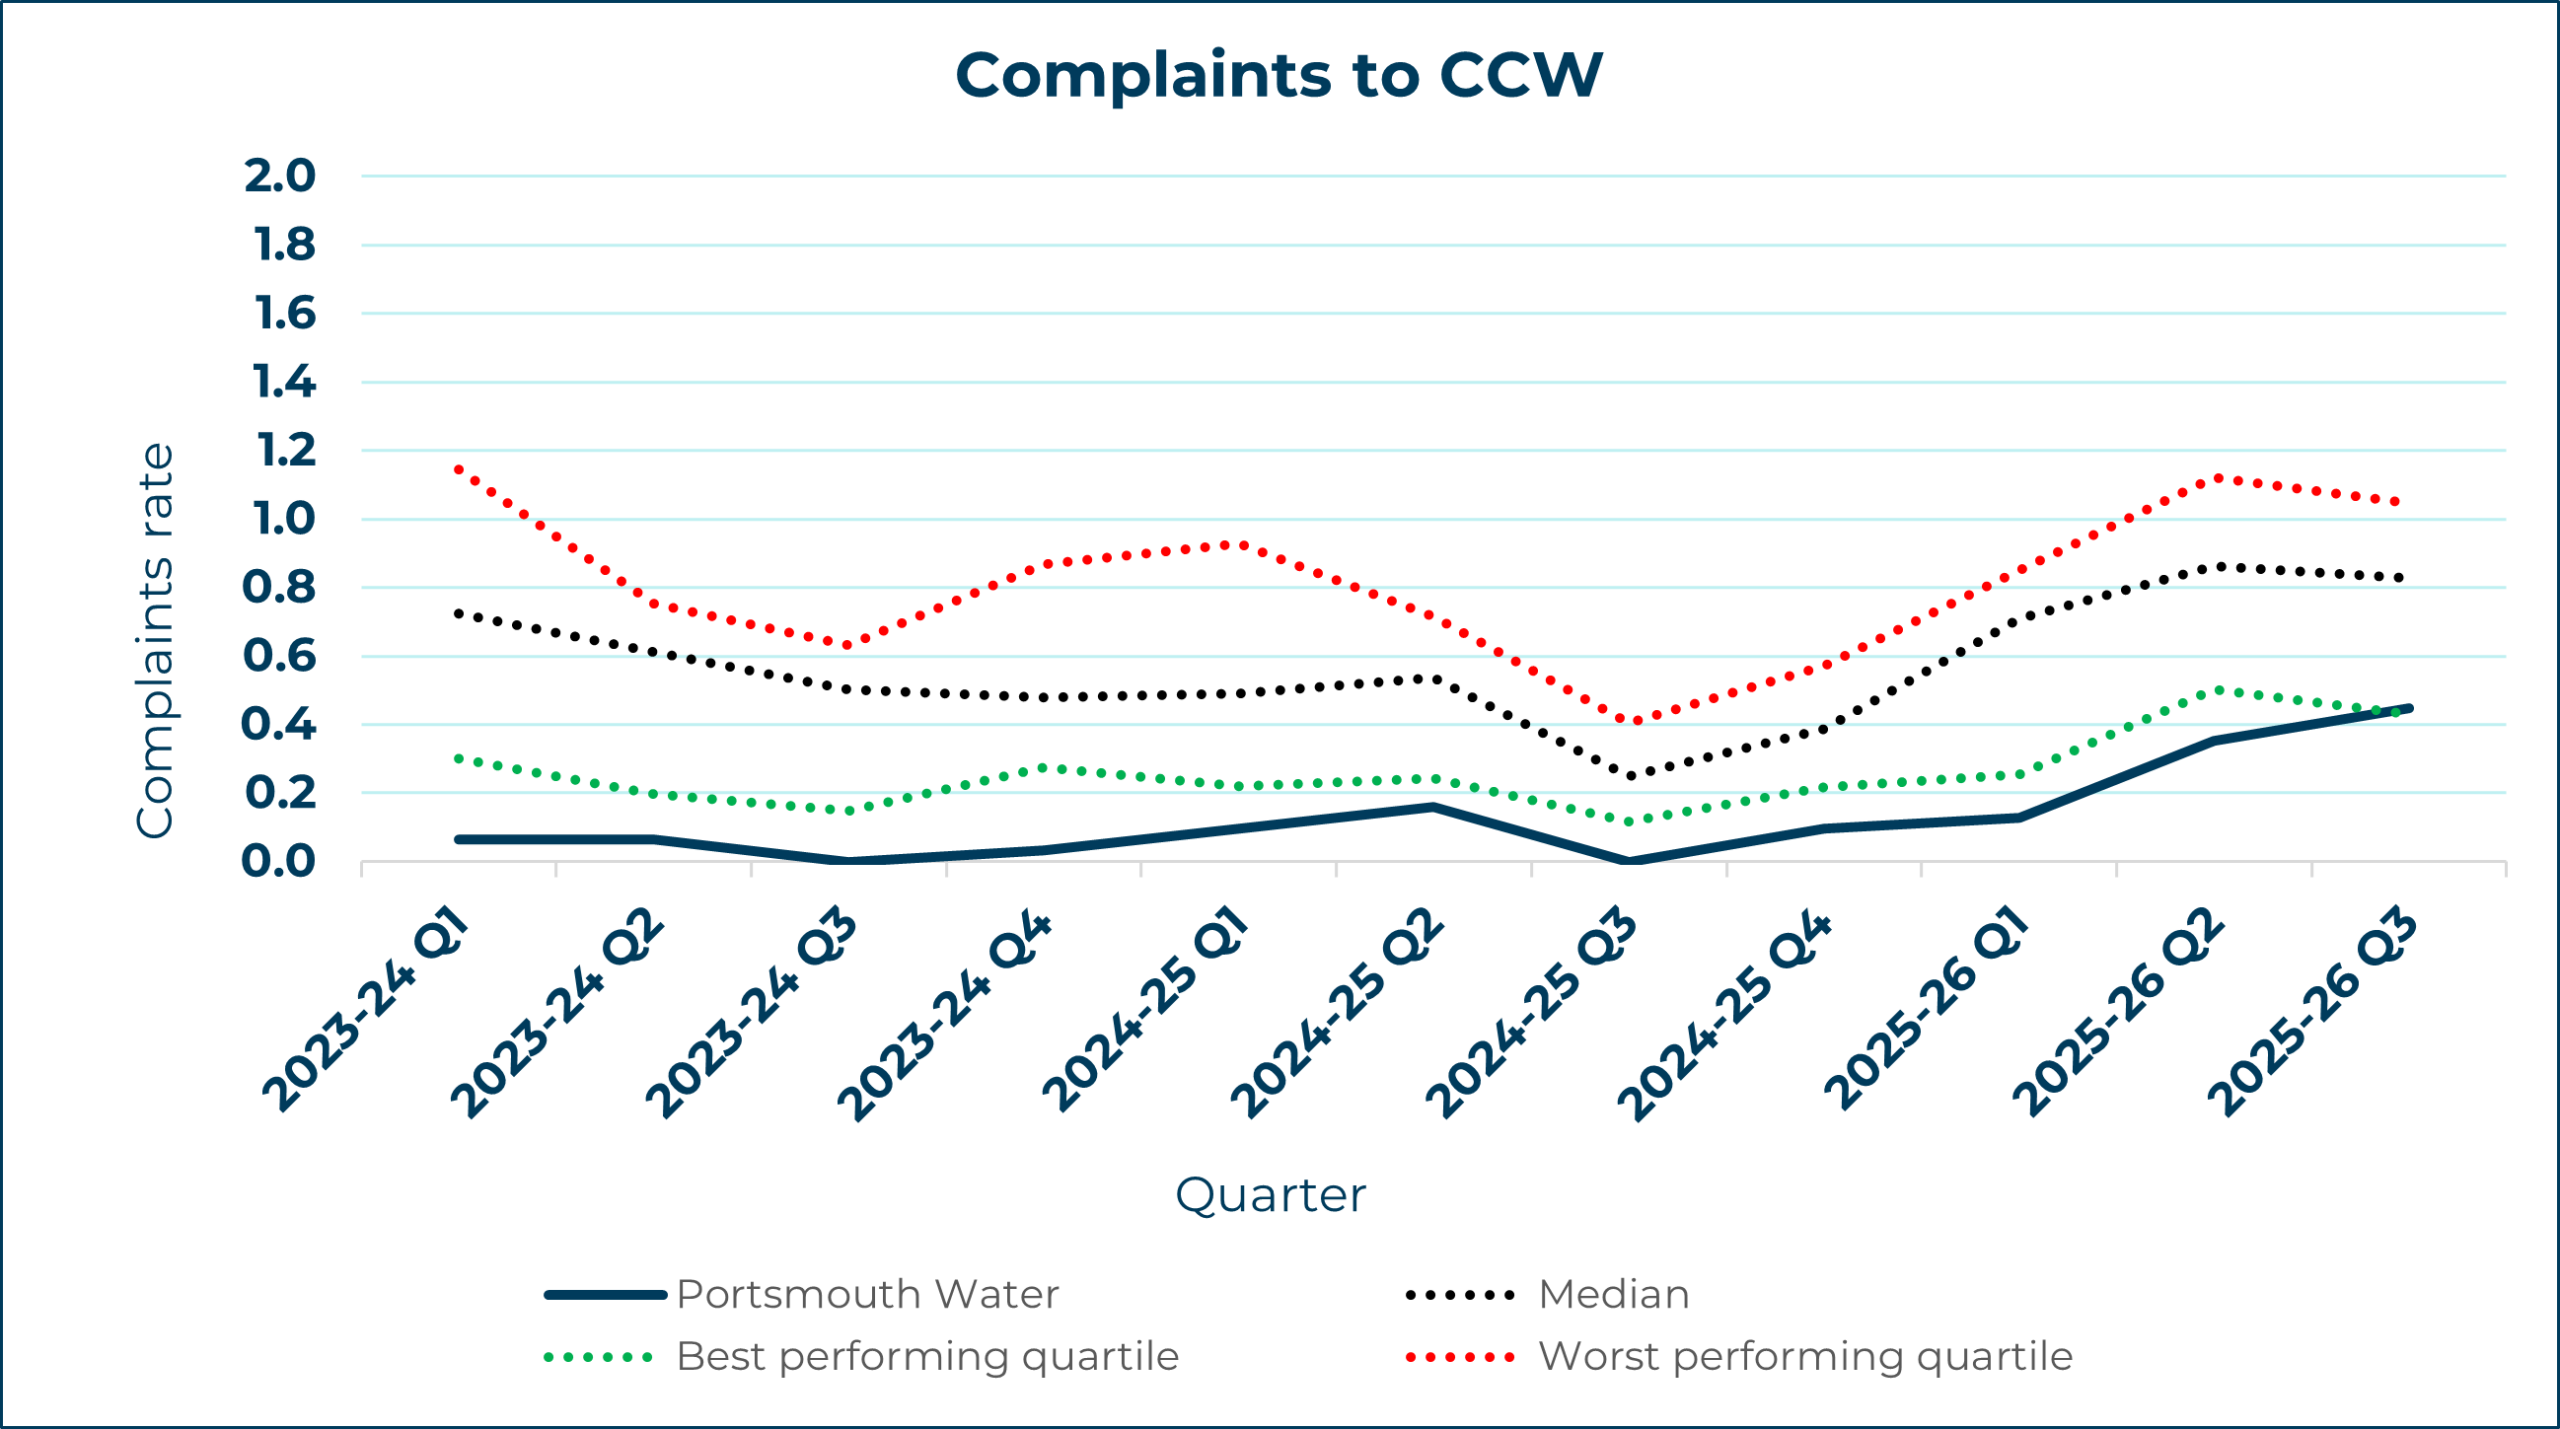
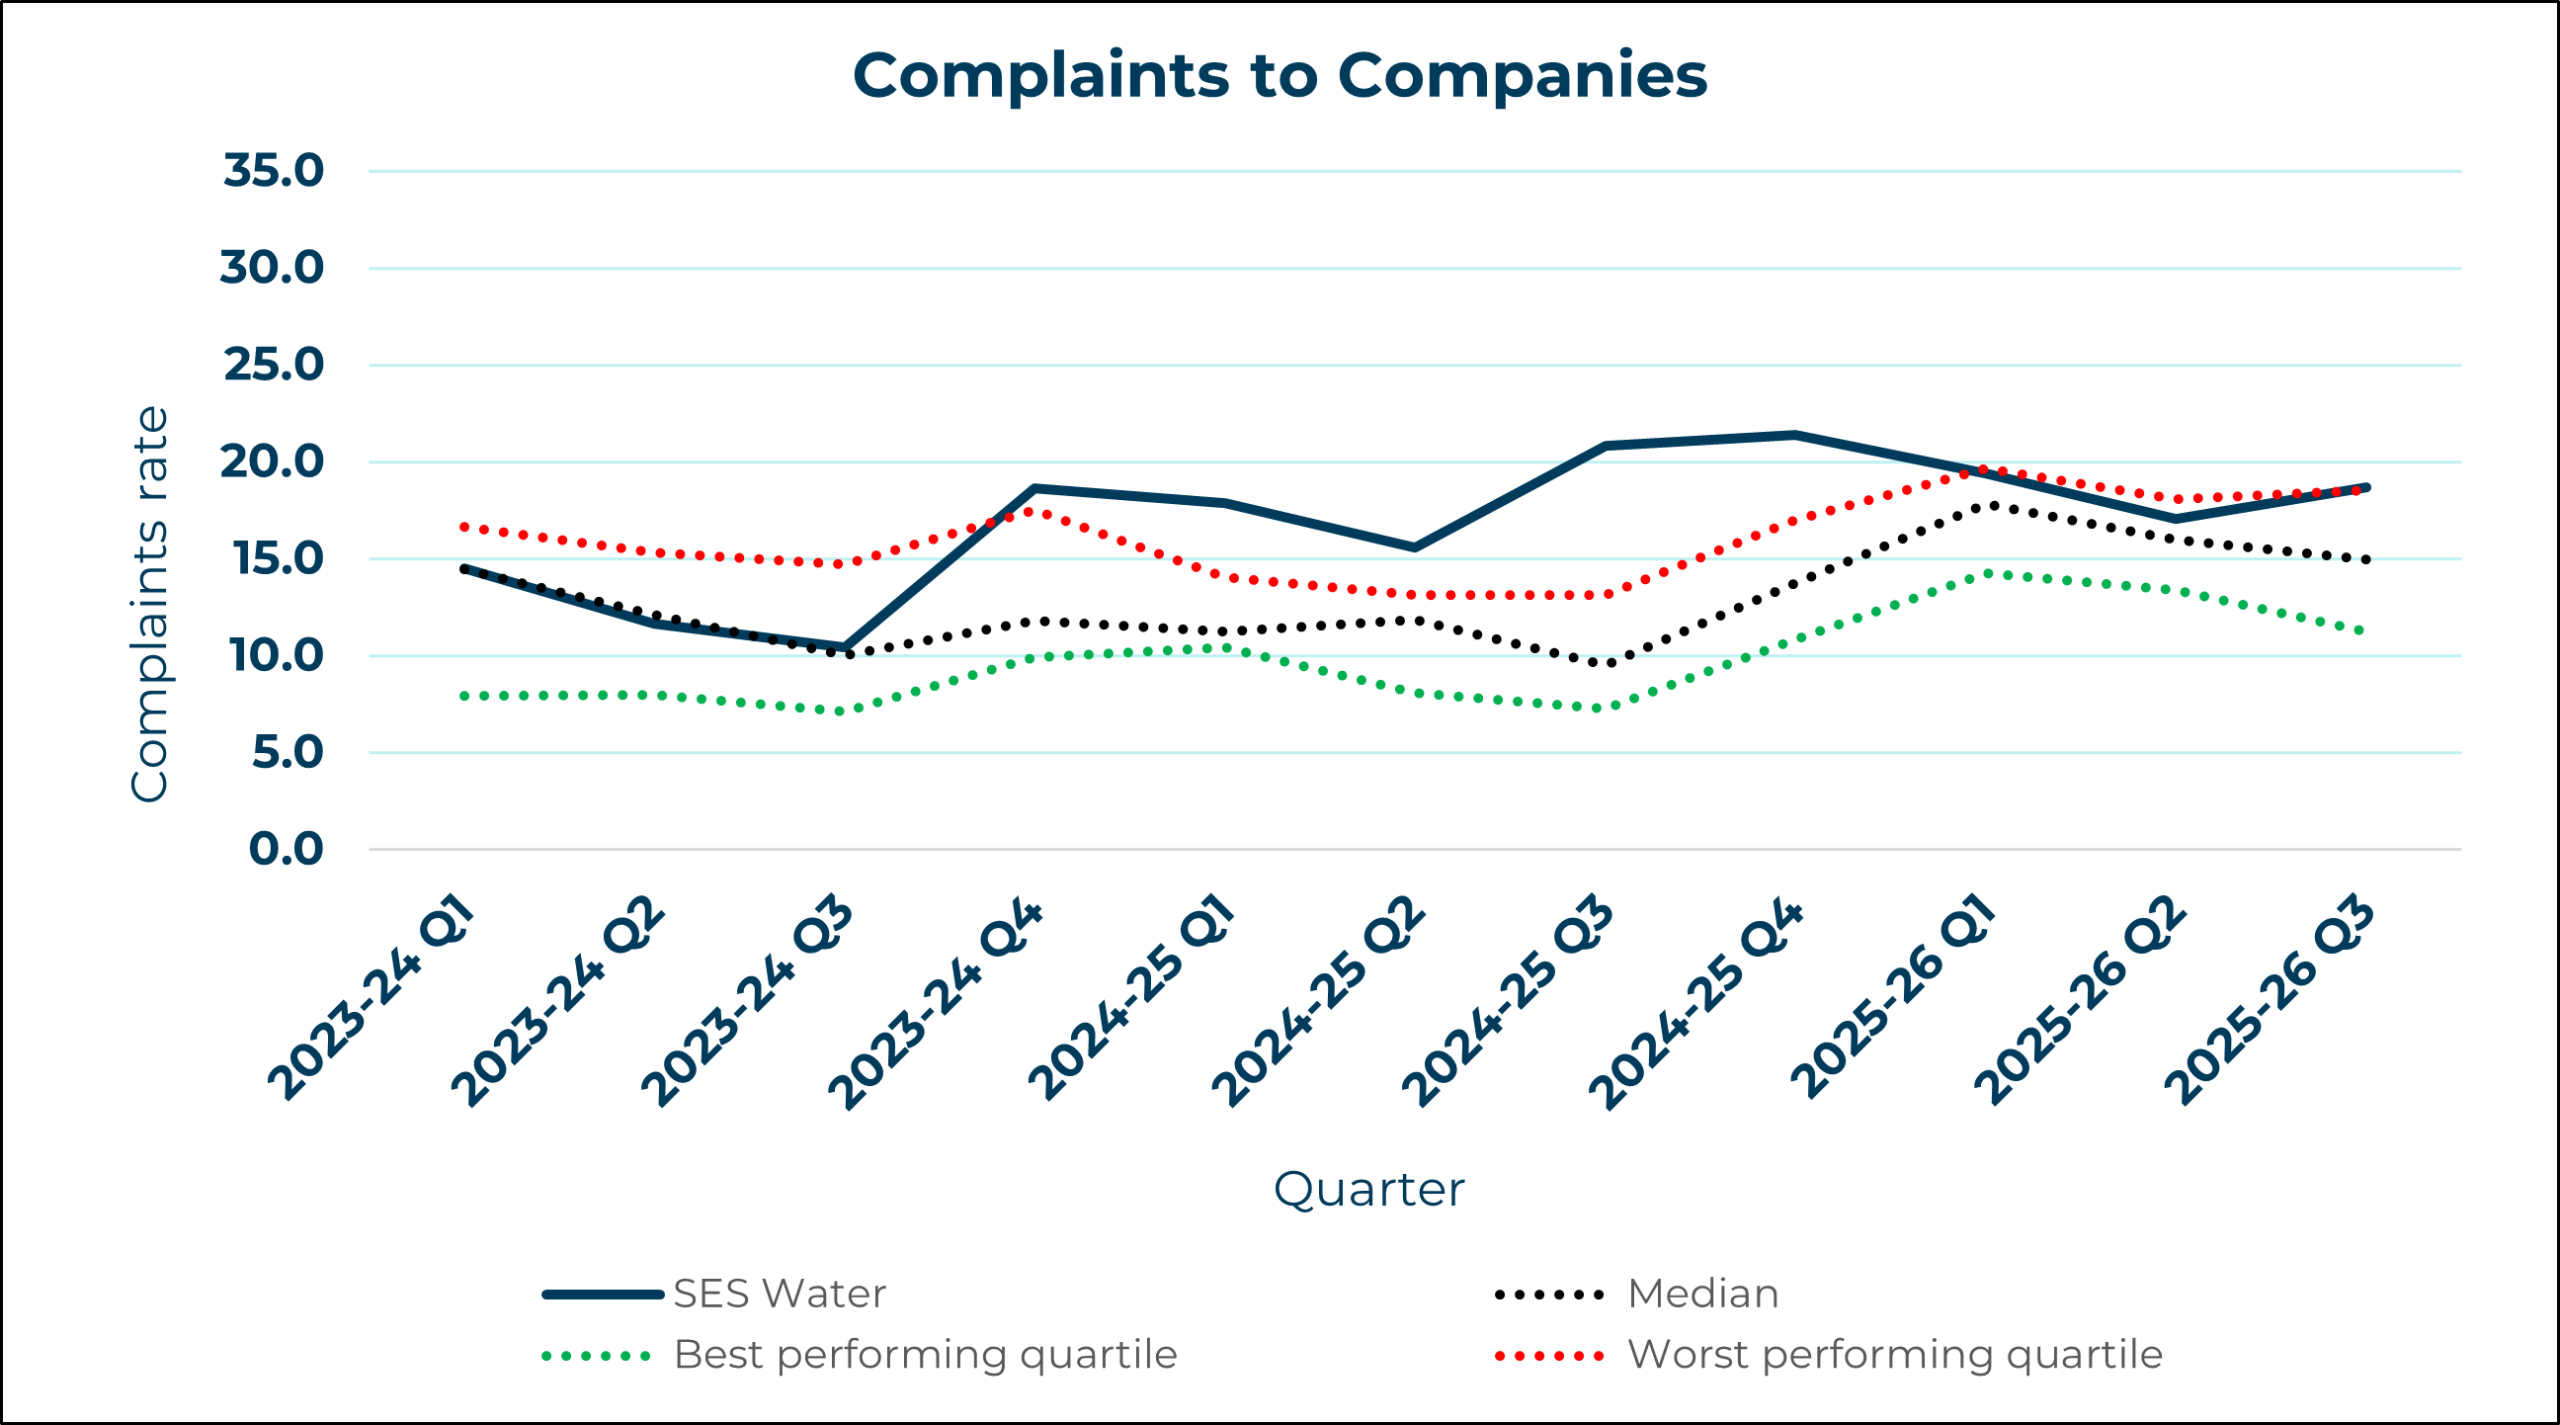
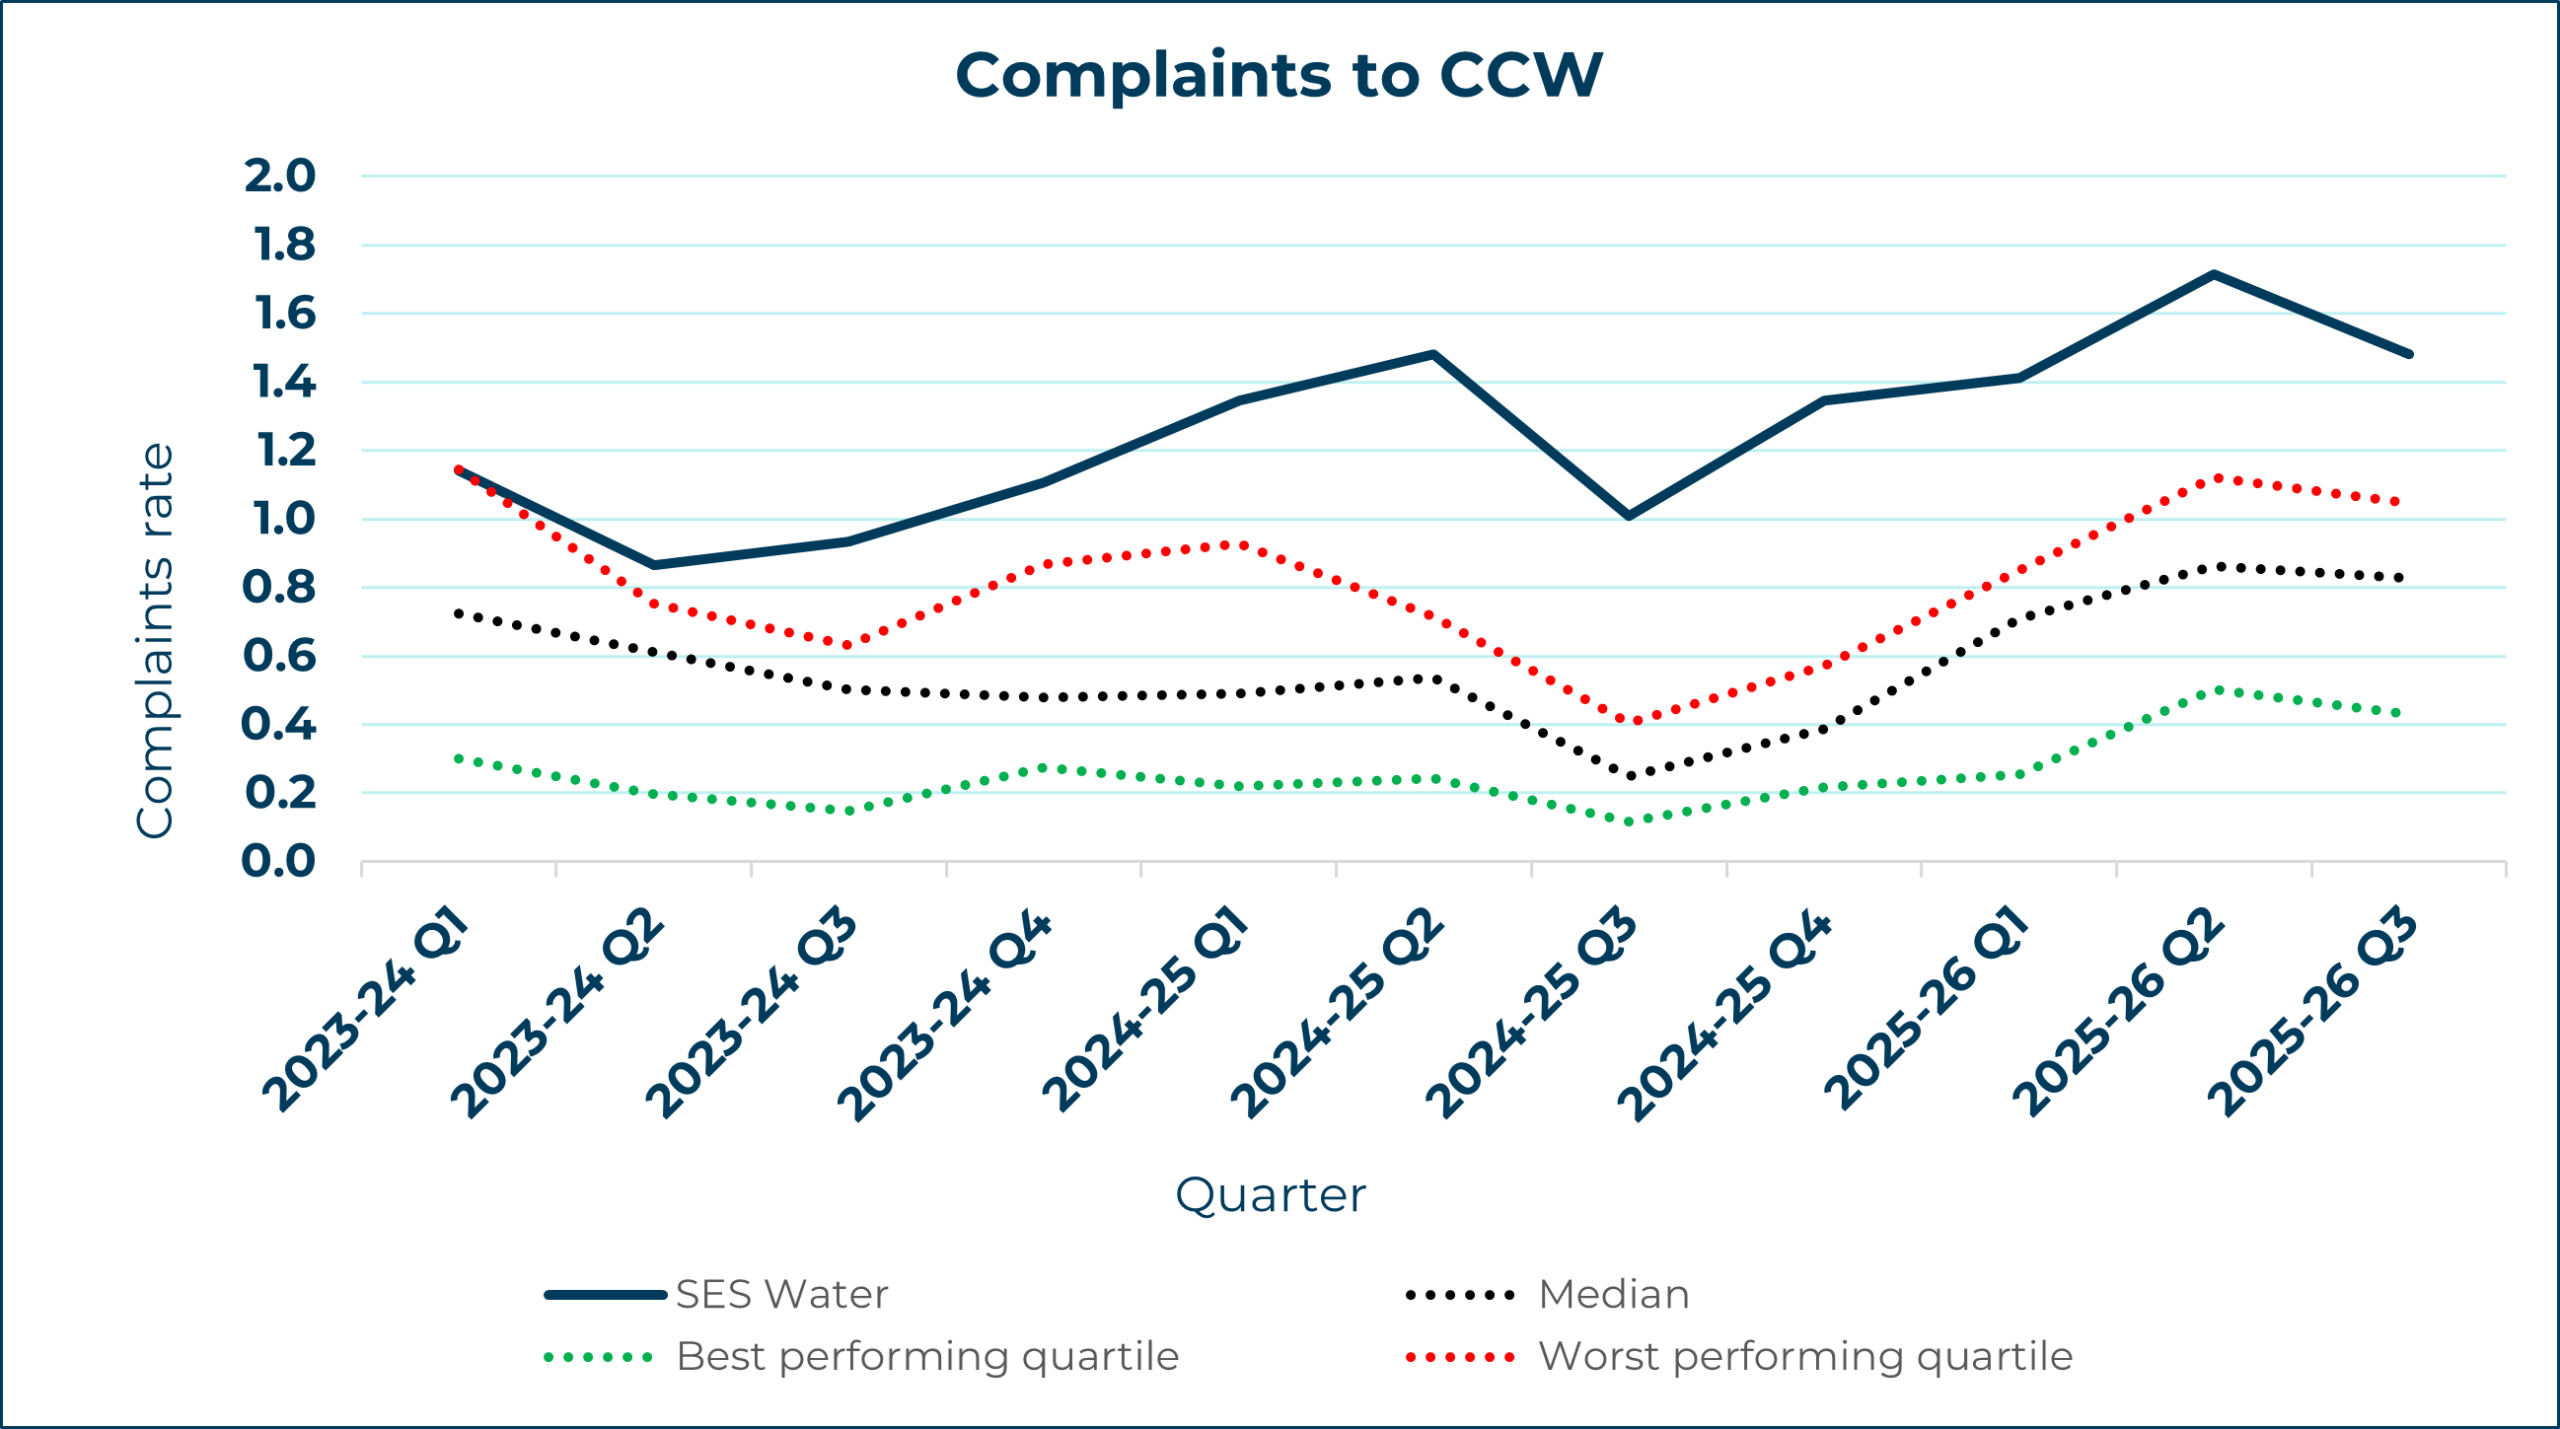
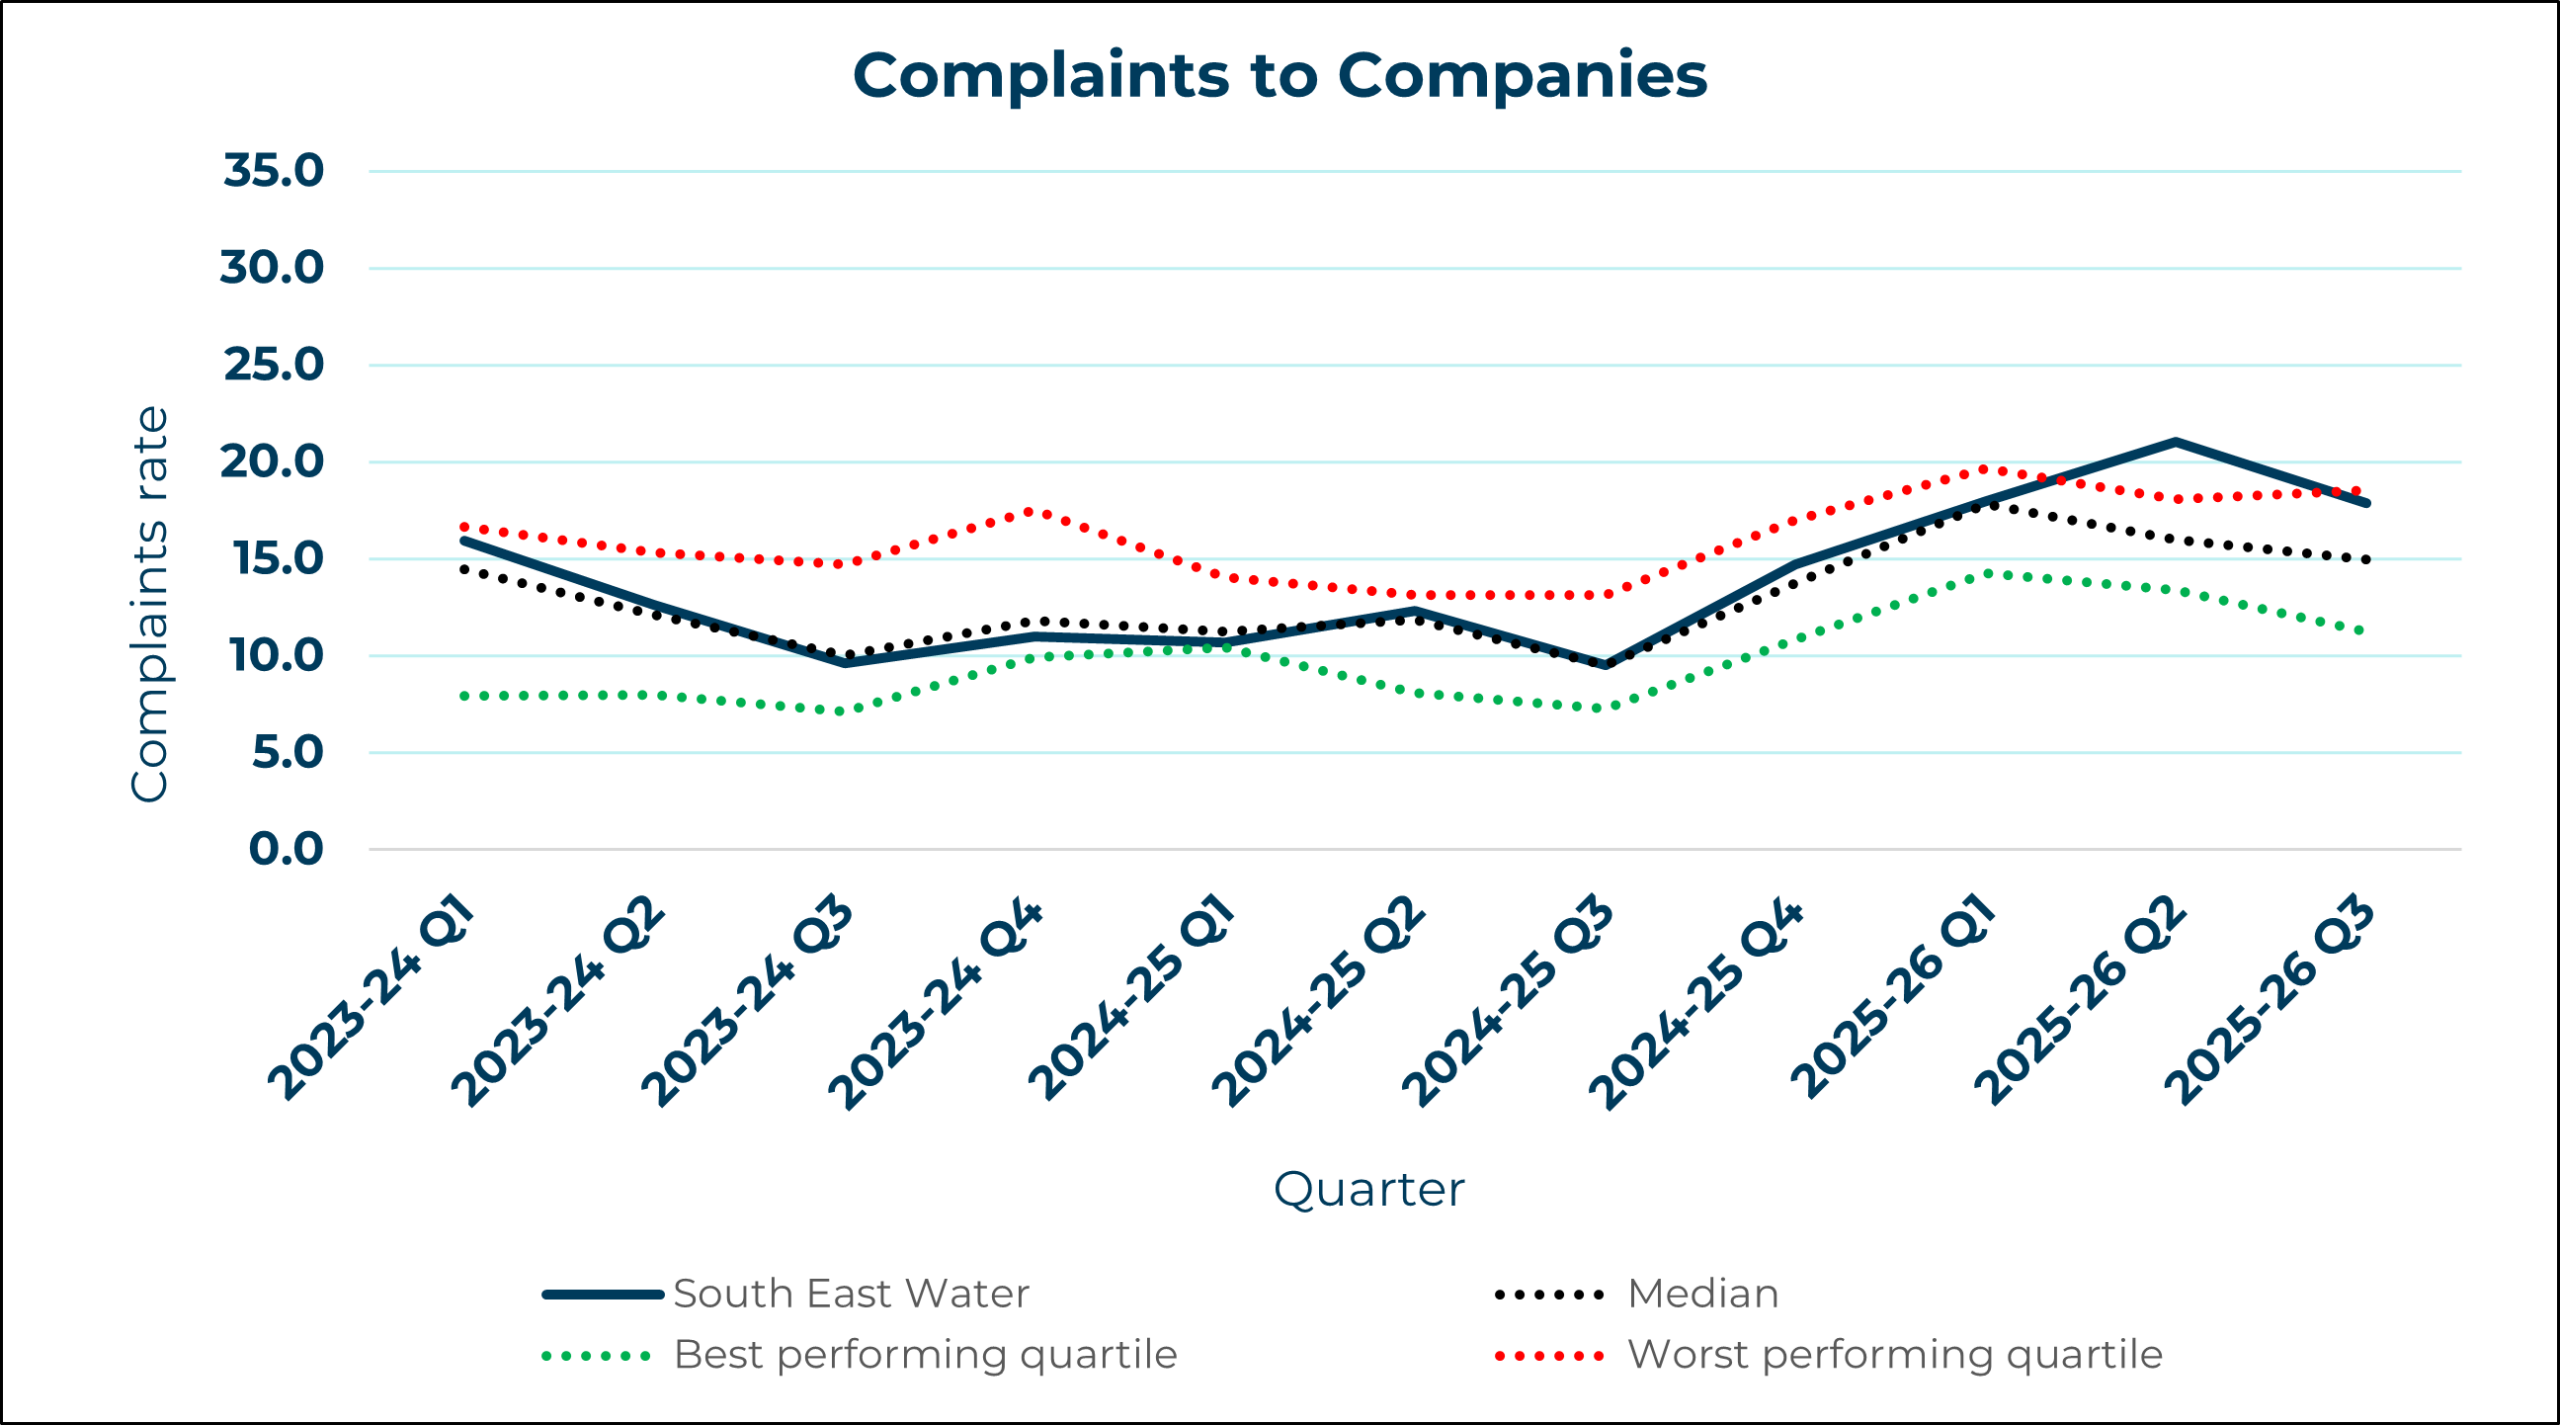
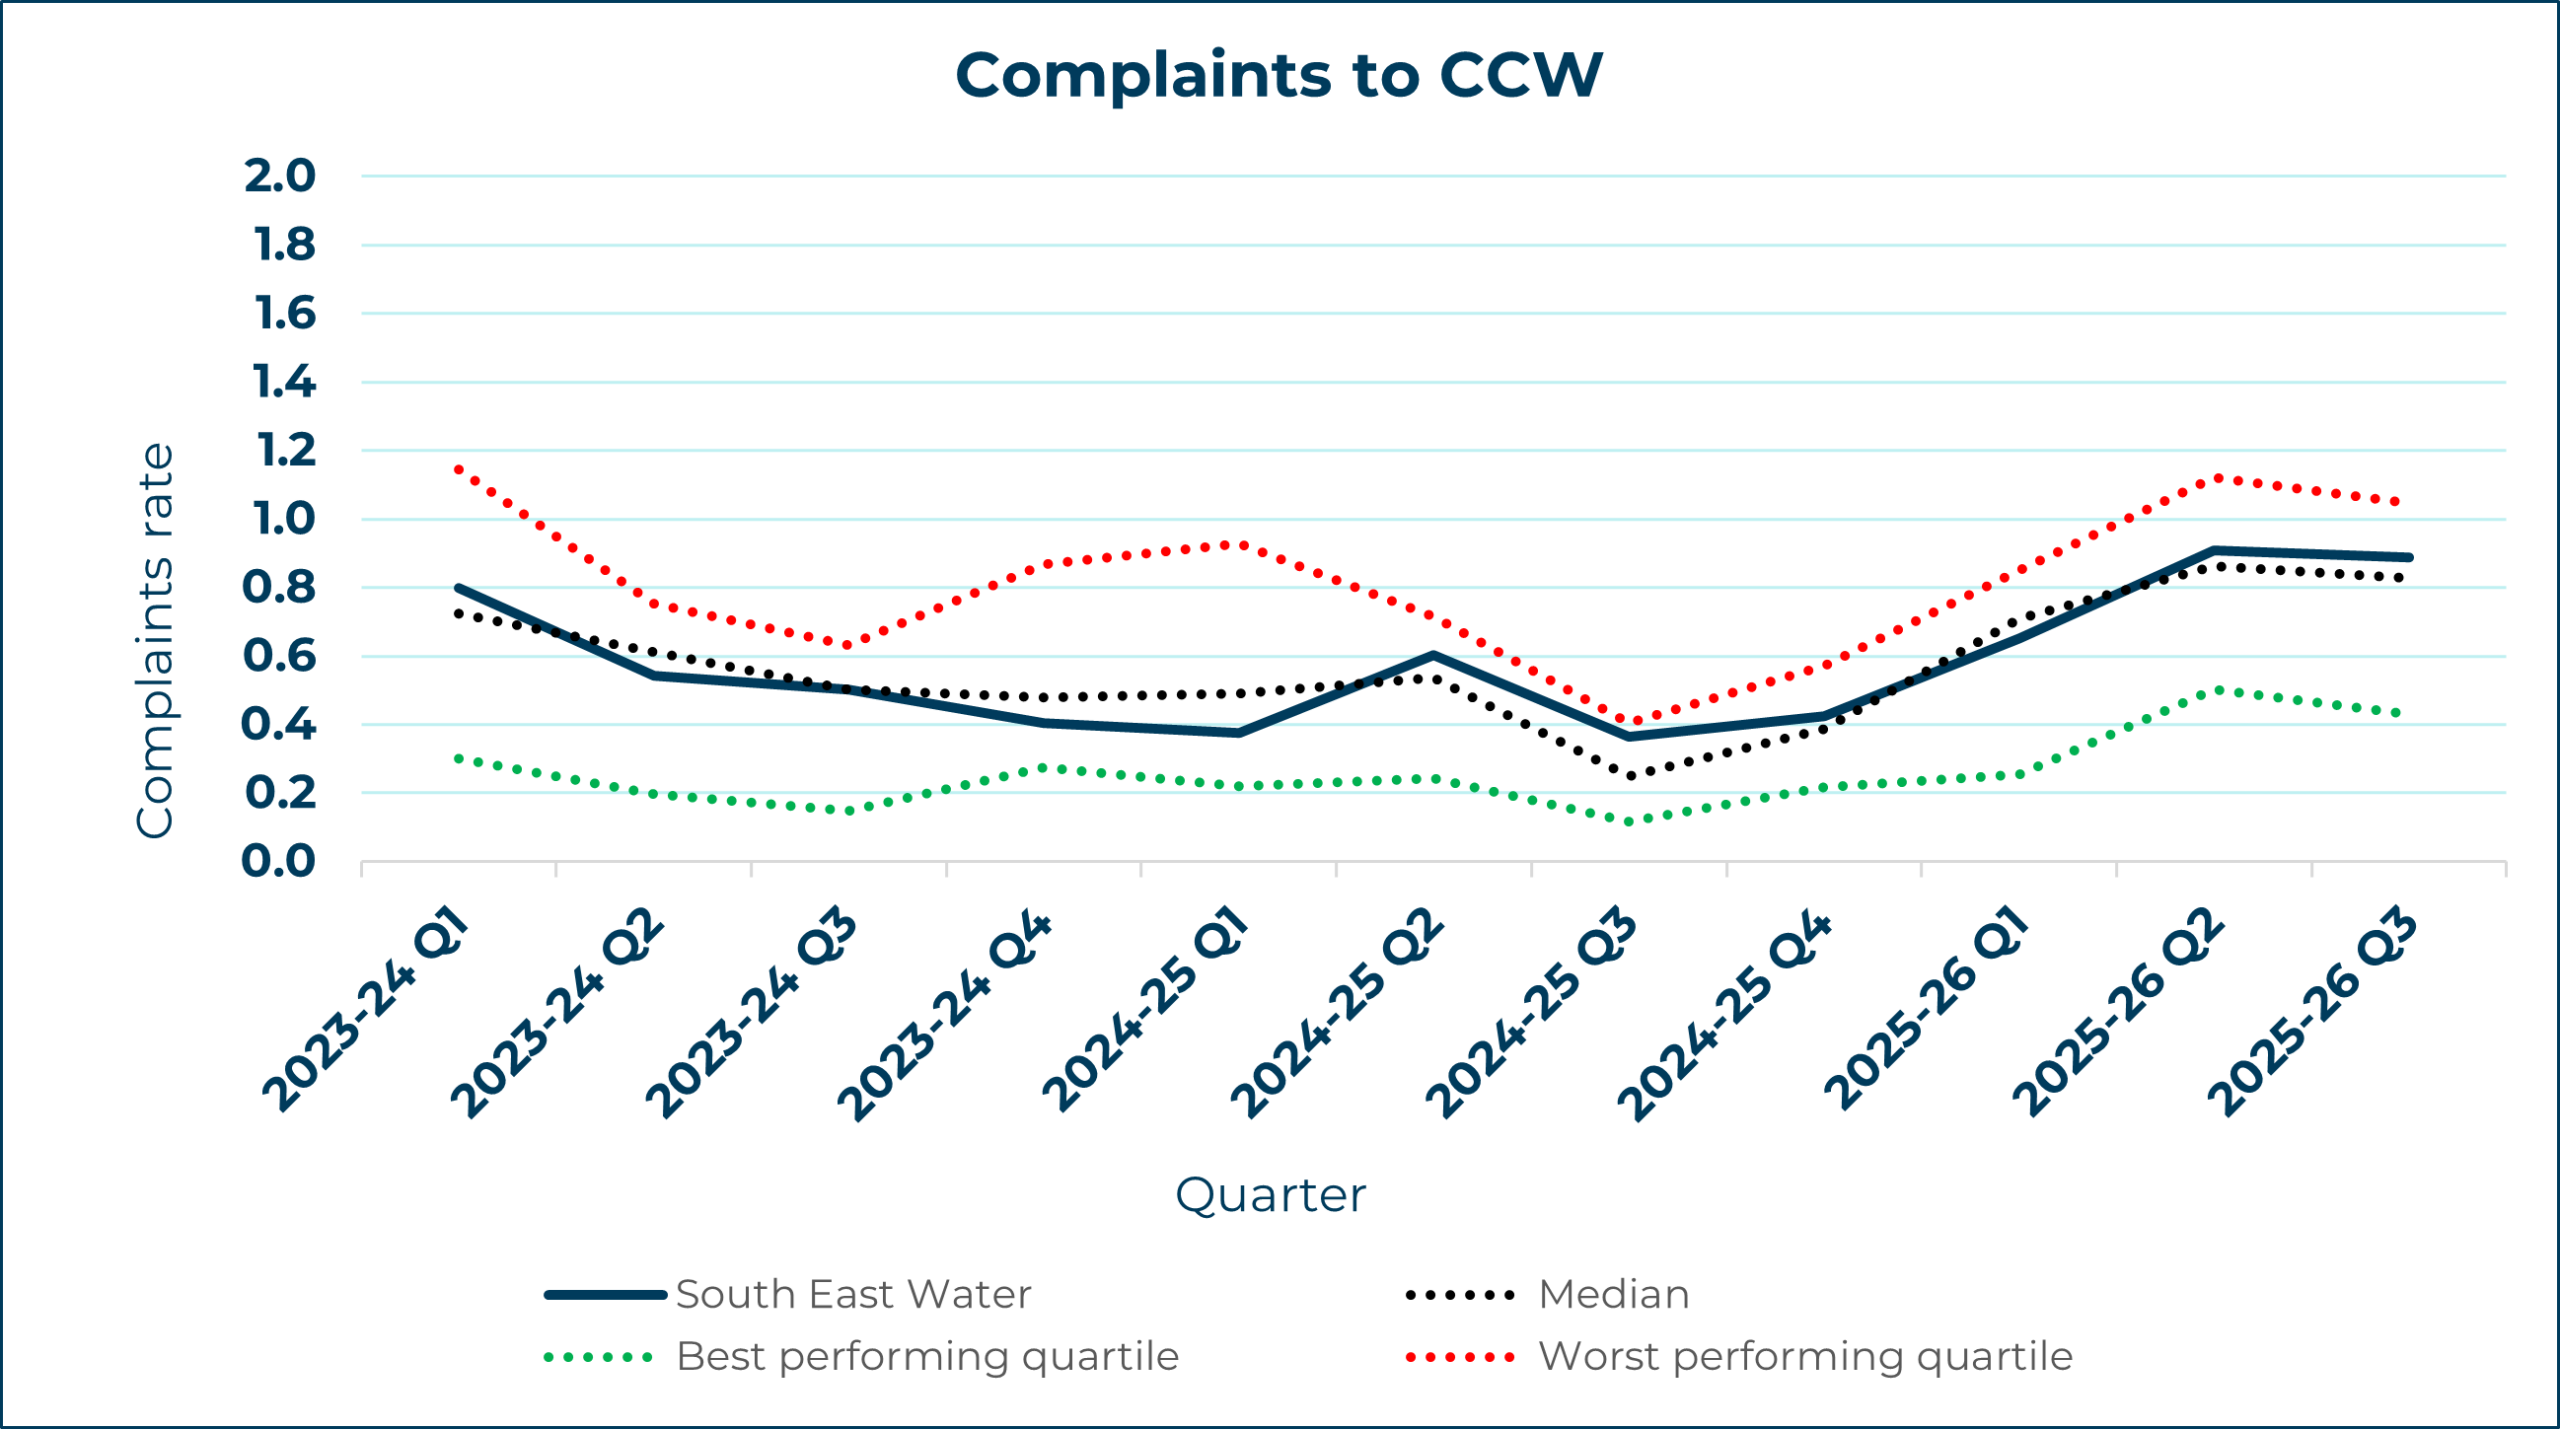
Complaint trend
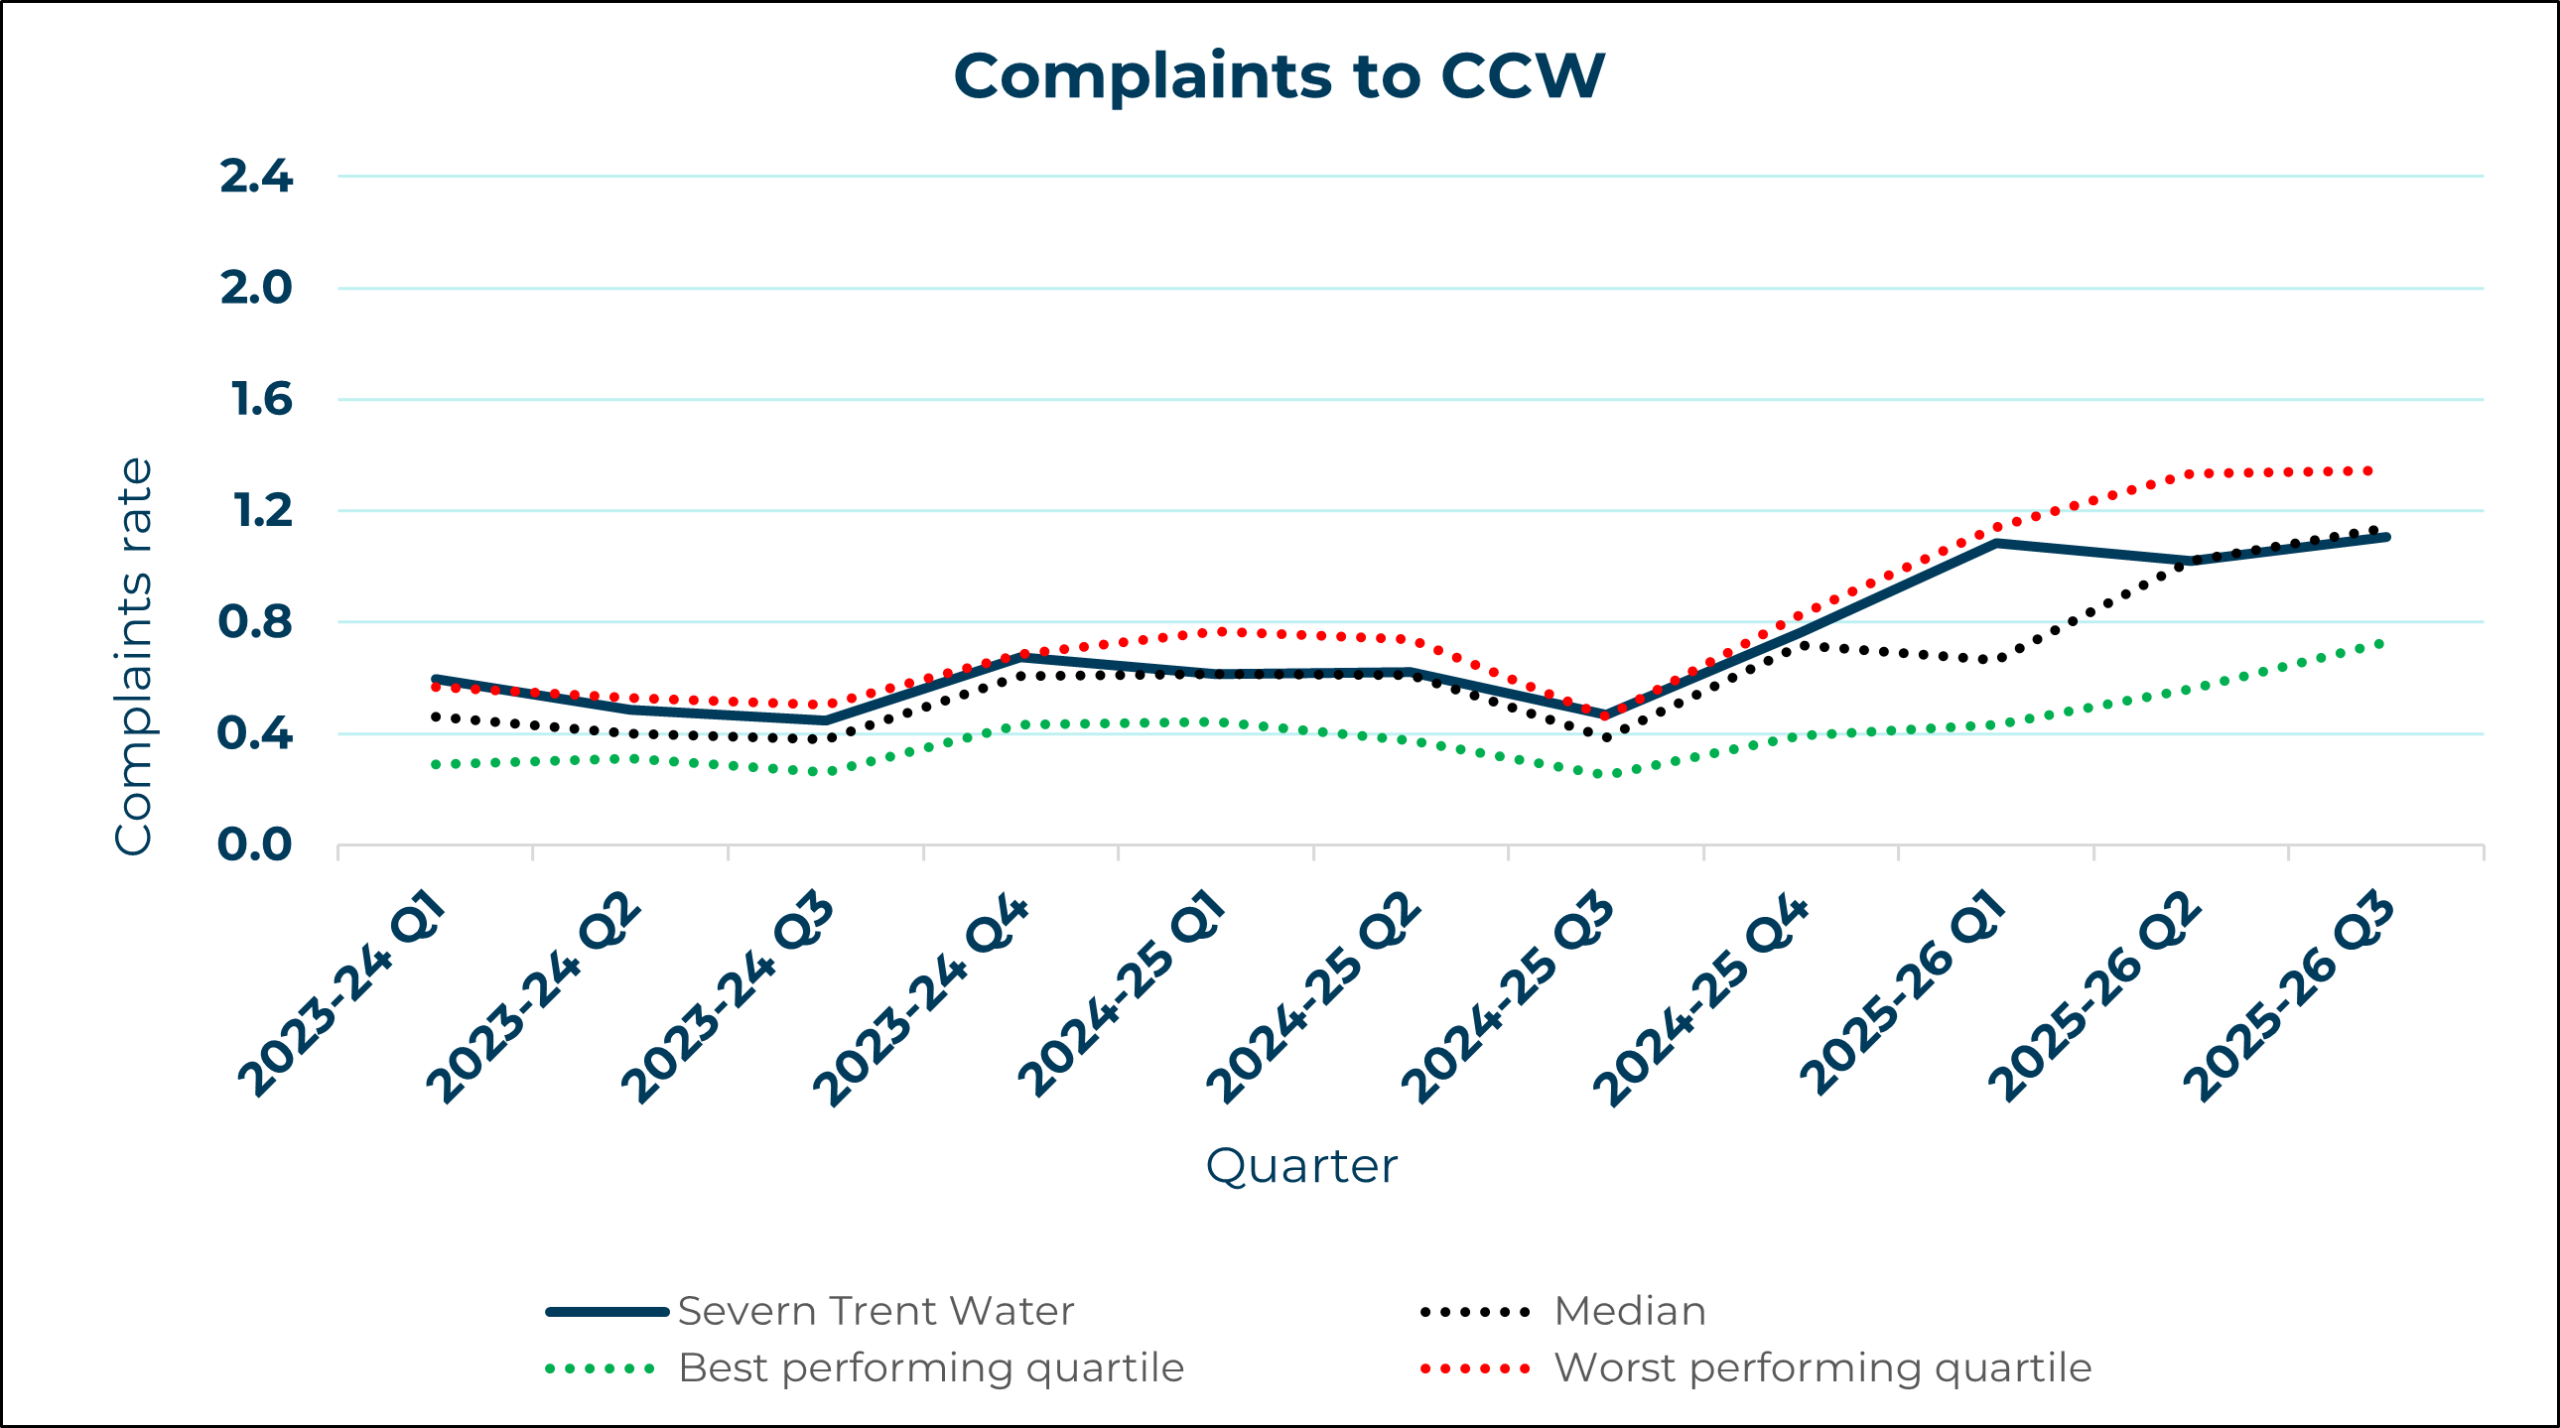
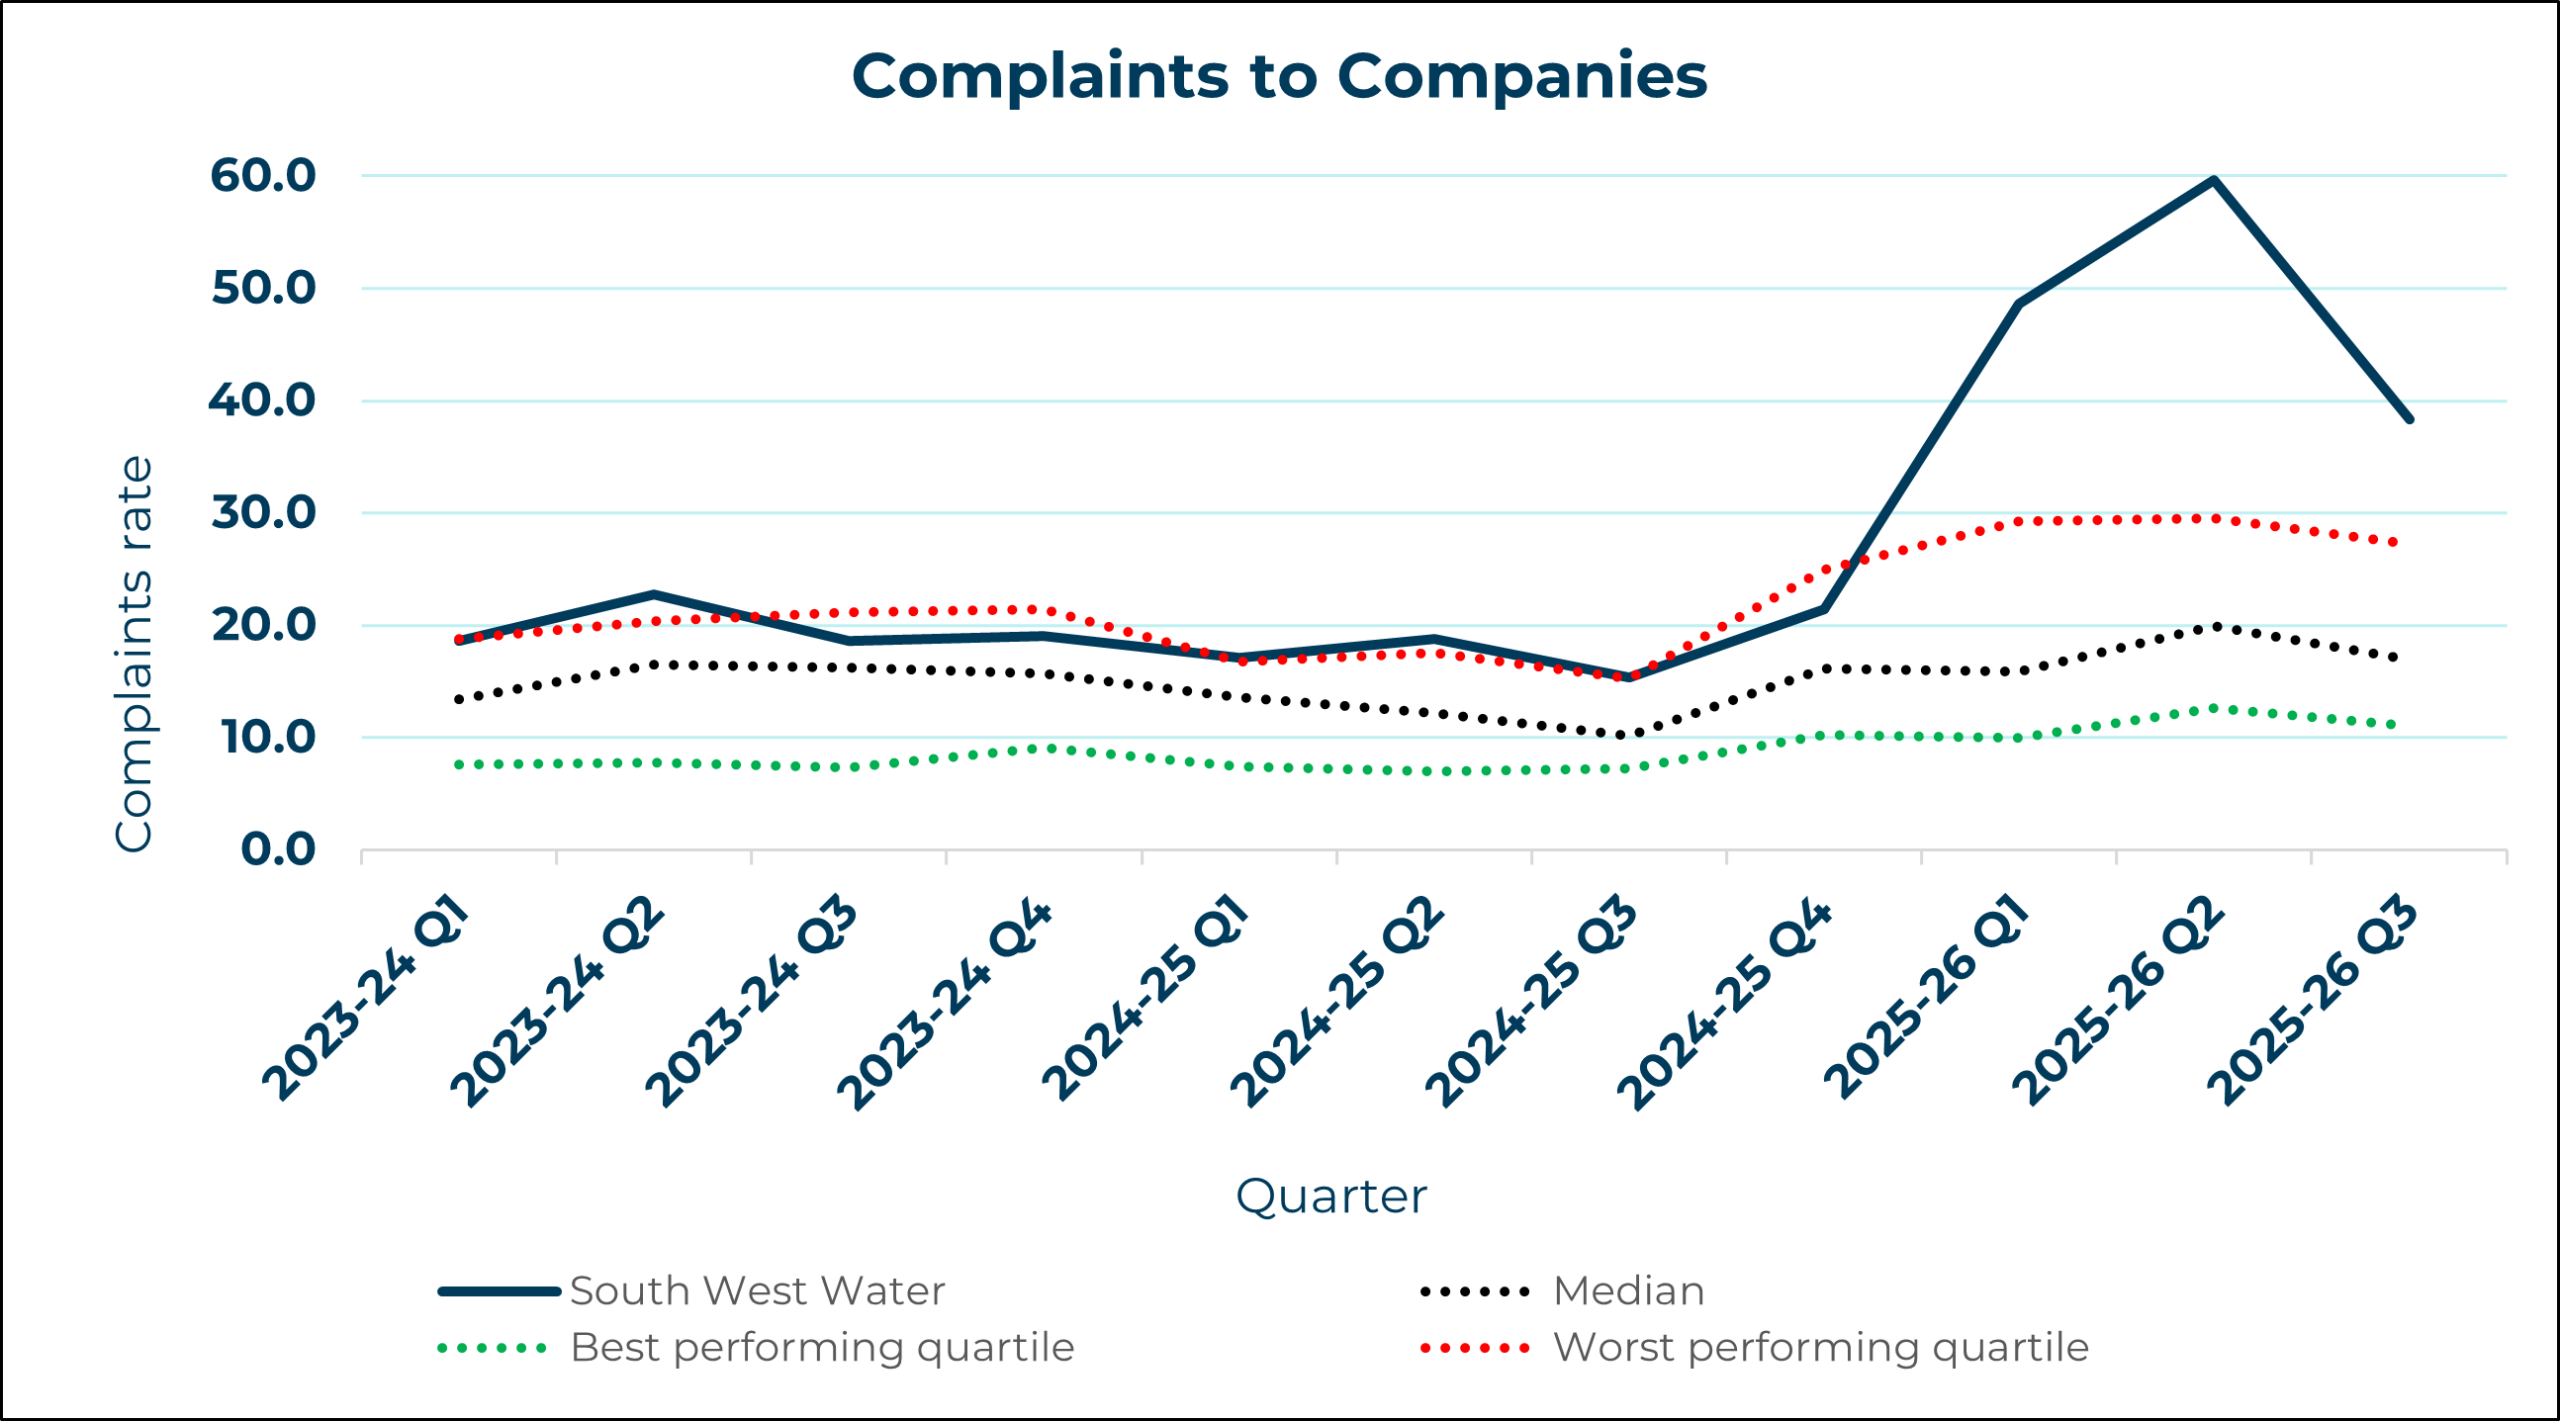
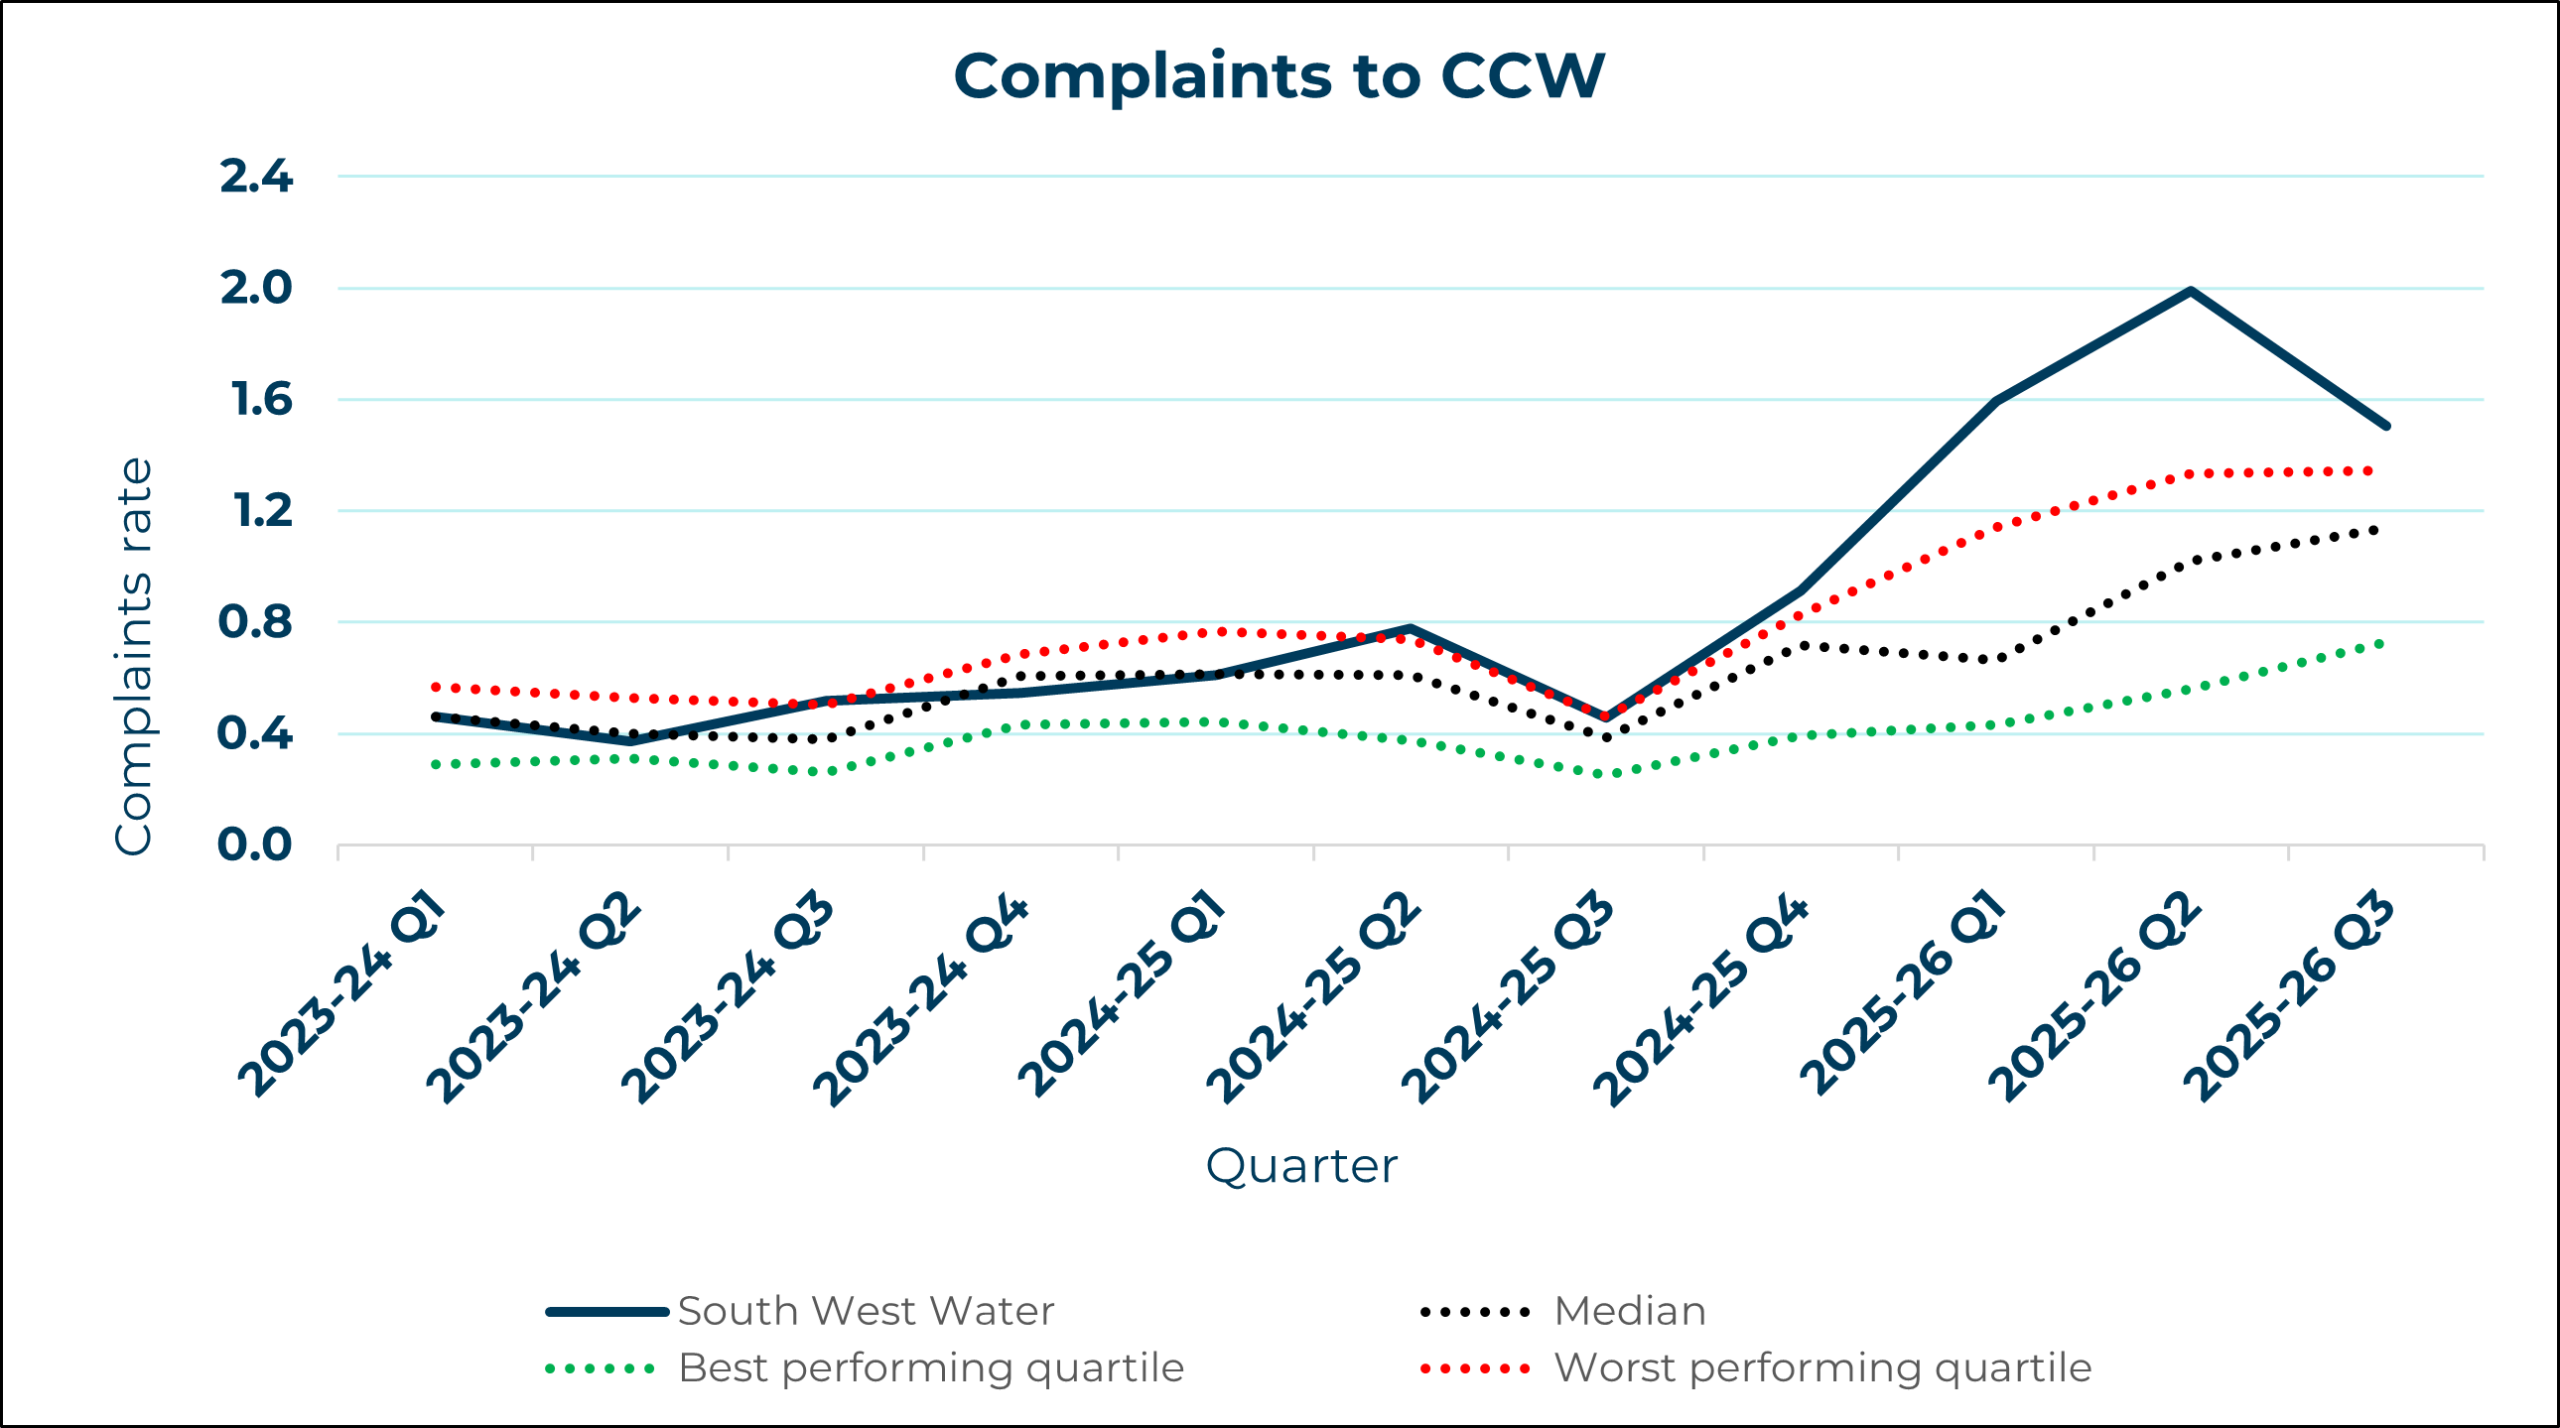
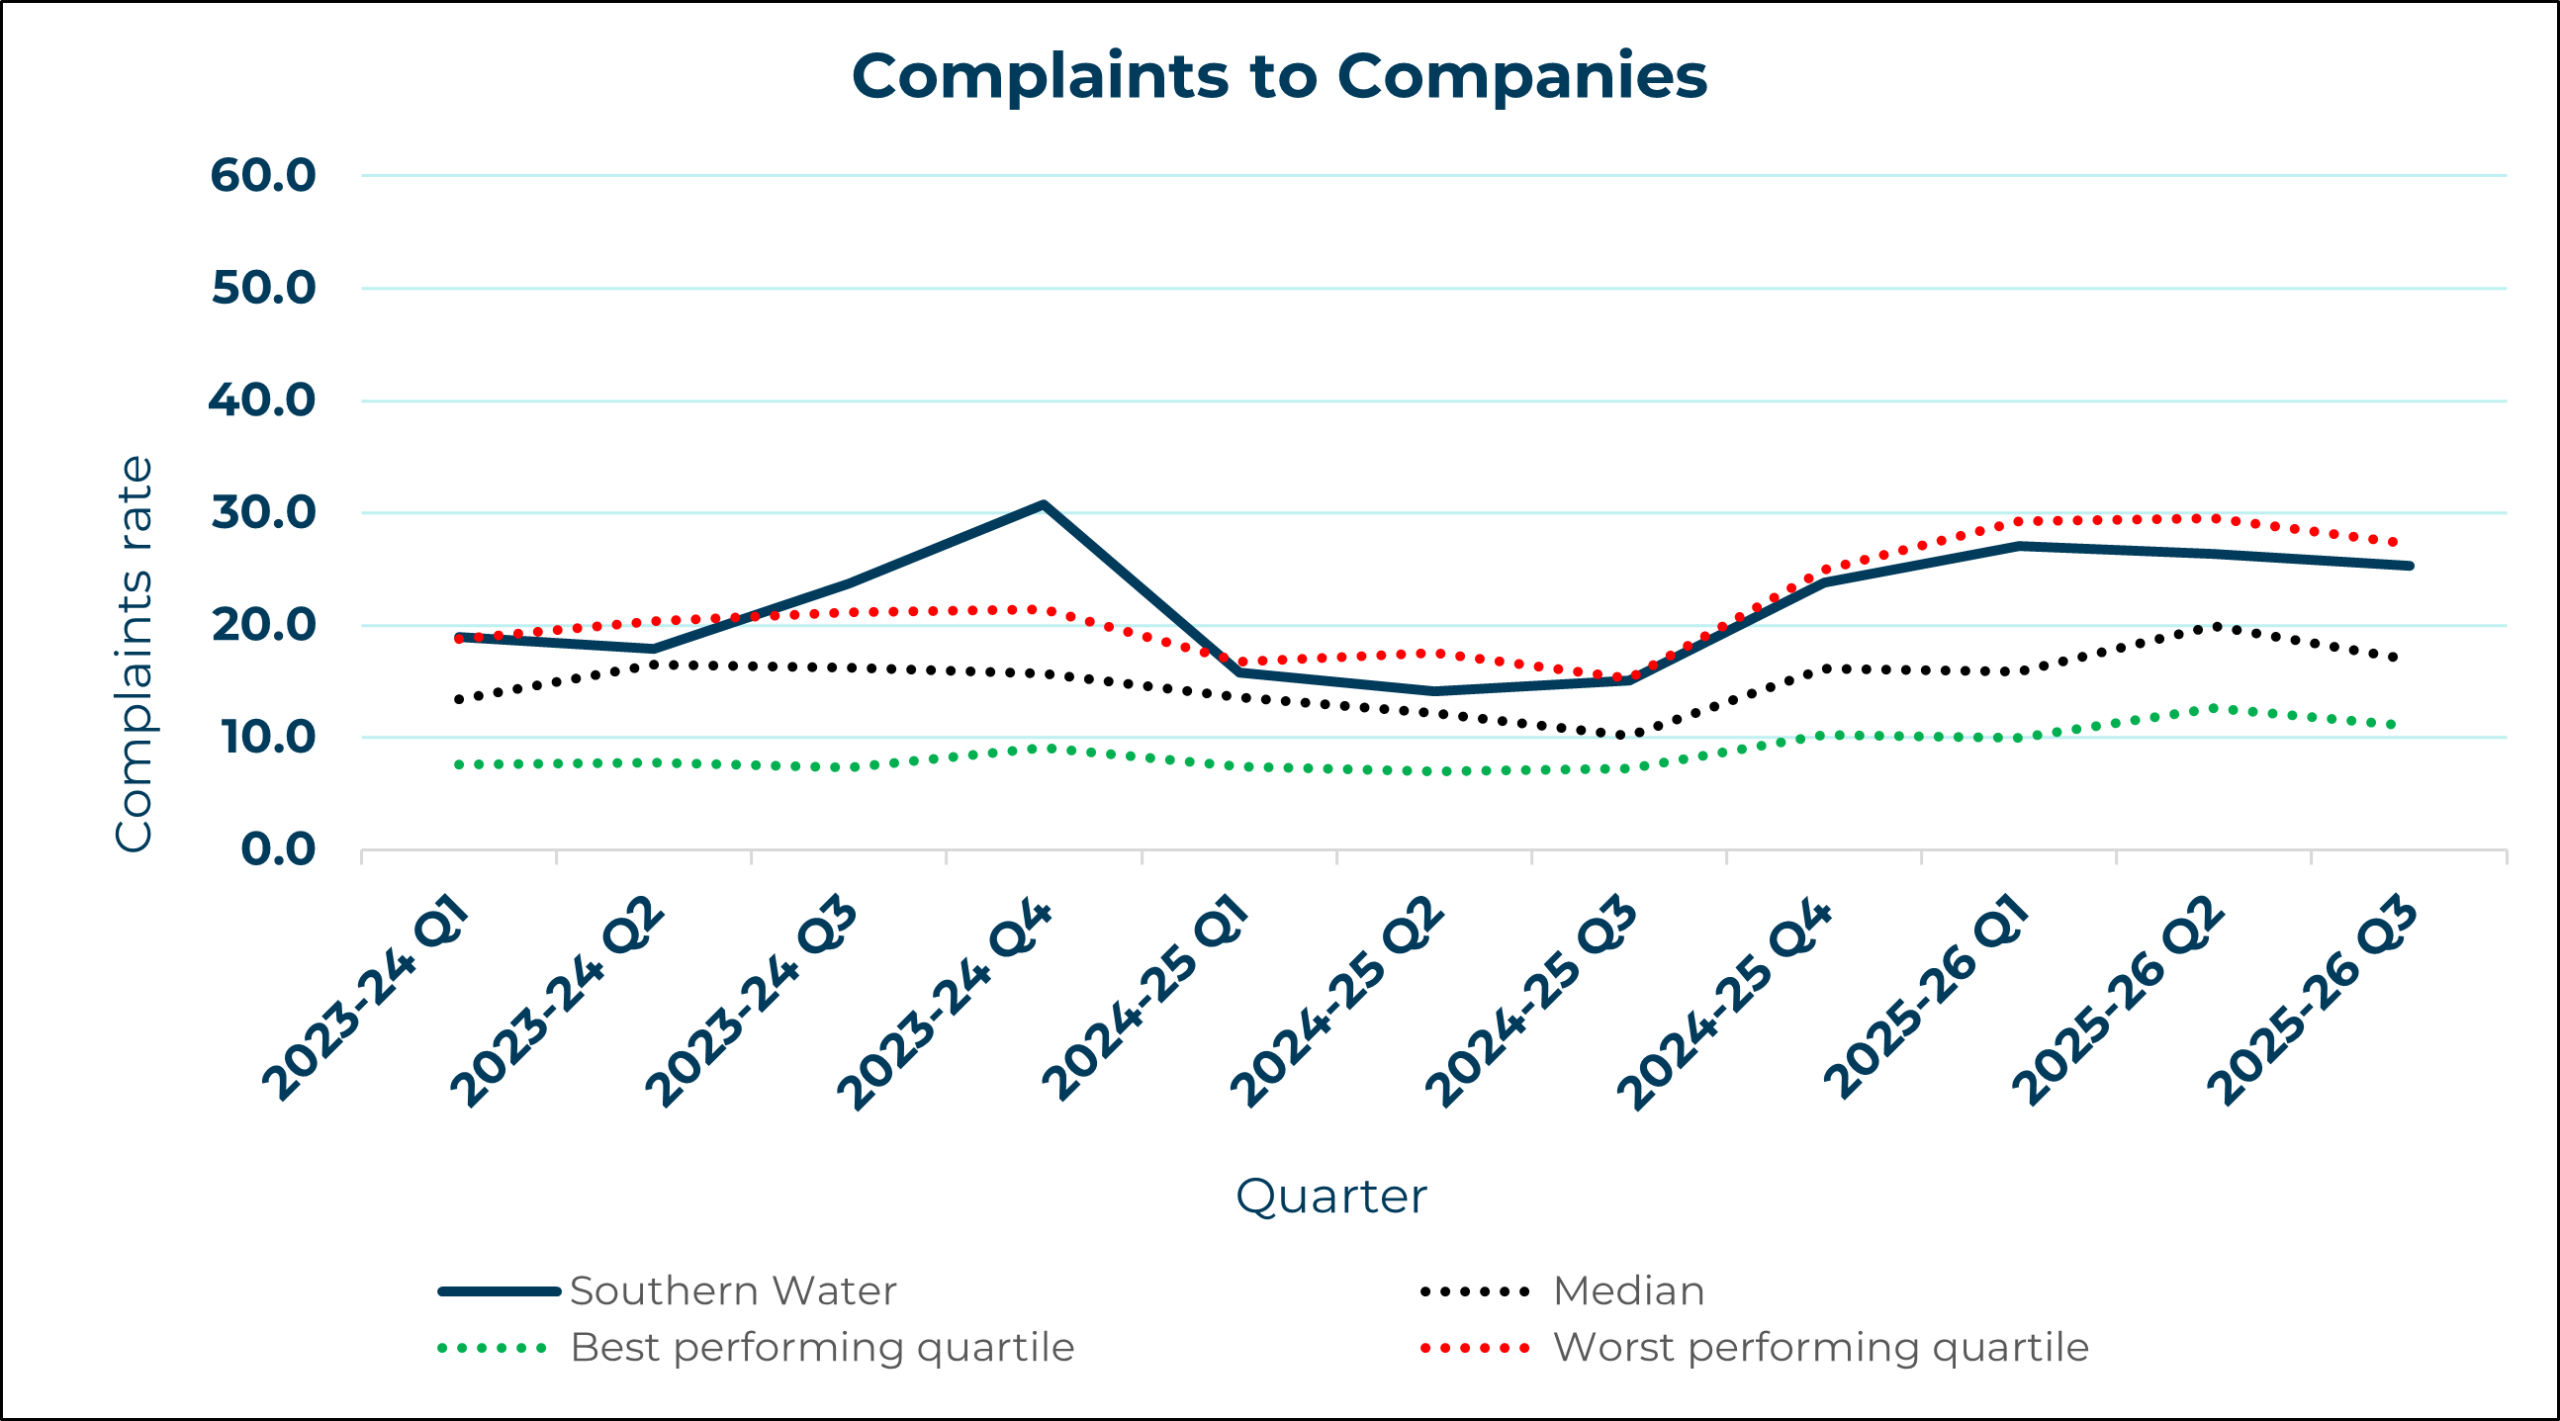
Below, you’ll find graphs that track how company complaint trends changed over time. First graph shows complaints received by company per 10,000 connections, while the other illustrates complaints reported directly to CCW per 10,000 connections.
Key
| Company performance | |
| Poor – if company performance is above line | |
| Median* performance | |
| Good – if company performance is below line |
*Median – a mid-point of the data set, or a middle value in the list of numbers that are arranged by highest to lowest.
Water and sewerage companies
Anglian Water
Dŵr Cymru Welsh Water
Hafren Dyfrdwy
Northumbrian Water
Severn Trent Water
South West Water
Southern Water
Thames Water
United Utilities
Wessex Water
Yorkshire Water
Water only companies
Affinity Water
Bristol Water
Cambridge Water
Essex & Suffolk Water
Portsmouth Water
SES Water
South East Water
South Staffs Water