

Trust Matters: Insights from Water Matters 2026

Water Matters report – what are the findings telling us?
Our latest annual Water Matters tracking survey was published back in May. As the longest-running in-depth survey of water customers, this research gathers a lot of detail, which is why in recent years we have begun following these up with a series of shorter ‘Mini Matters’ reports. These each look in greater depth at specific themes from the latest Water Matters data.
This summary looks at the increasingly relevant issue of trust. Amidst falling scores across a wide range of Water Matters’ metrics in recent years, one of the most prominent stories has been the steady collapse in customer trust in the water industry: the overall trust score across England and Wales fell this year to just 6.07 out of 10, the lowest score in Water Matters’ sixteen-year history.
Low customer trust has also been a theme of other CCW research, including particularly this summer’s Spotlight report from CCW’s customer panels, which gives us valuable additional insight on trust-related topics, and will be discussed below. Low trust is not just concerning in and of itself, but also for the way it affects satisfaction more broadly across a range of issues. Below, we explore trust-related findings from the latest Water Matters in more detail.
This year saw record low trust scores
Figure 1, below, shows the long-term trend data which puts into context the declining trust scores we have been seeing in Water Matters. This comes alongside customers’ increasing perception of poor environmental performance from companies, and long-term decreasing satisfaction with value for money of bills.
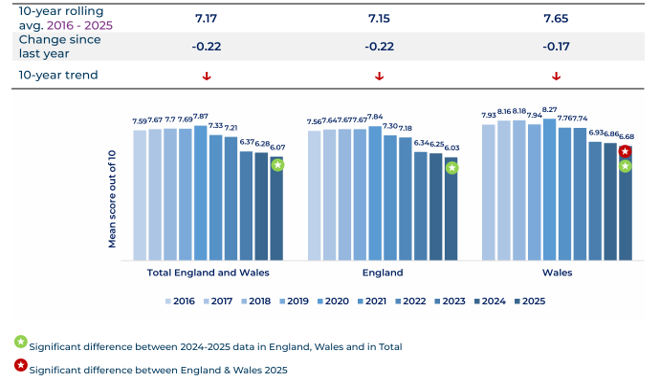
While trust remains much higher in Wales than in England, both have seen significant declines from last year’s previous record low. Having peaked in 2020, trust has been falling since then; indeed, this year the 10-year trend for this metric is now negative for the first time, having previously been stable.
The reason for this is that, while for a number of years the percentage of customers giving ‘neutral’ trust scores (i.e. scores of between 5-7) was slowly rising, in more recent years there has been a sharper rise in ‘negative’ scores (1-4). This year, almost a fifth (18%) of customers gave a negative score, just over half the number of those who gave a positive score (35%). This still leaves almost half of all customers with neutral perceptions of trust, for companies to turn positive again.
We also measure customer trust in their gas/electricity company, as a comparison point across the wider utilities sector (see Figure 2*).
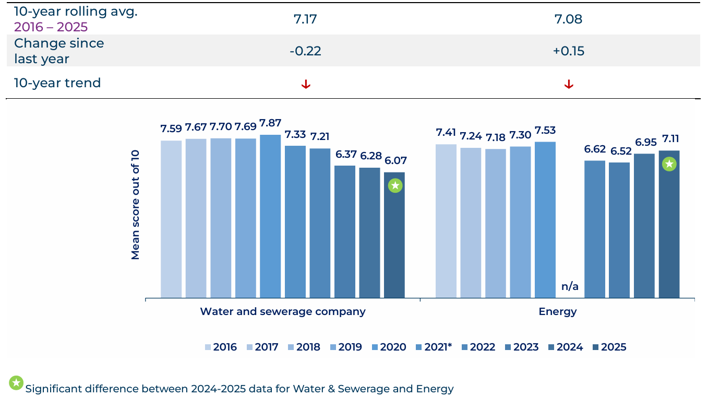
The contrast is significant: three years ago, trust scores for water and energy were at a similar level (6.37 for water companies, 6.52 for energy companies – both, at that time, the lowest score ever recorded). Since then, however, the trust score for energy companies has been steadily increasing, so that this year it has reached 7.11, significantly higher than for water companies (6.07), and the highest level since 2021. Falling customer trust is focused specifically on water companies, but the evidence of rising trust for other utilities providers suggests that this can be reversed: trust in the water sector is out of step with other utilities, and requires action within the sector to reverse.
*Data is not available for trust in energy companies for 2021.
A varying picture at a regional level
In last year’s Water Matters report we showed how wide a regional variation there was when it came to customer trust: indeed, last year a majority – 11 out of 19 – companies actually increased their trust score, but the low scores of the worst-performing companies had dragged the overall average score down, from 6.37 to 6.28.
When looking at this year’s results, although the 10-year trend for trust scores are now negative for nearly all companies (with the exception of Bristol Water’s, which is stable), there is a similar story of regional variation. Though not as pronounced as last year, a number of companies (six in total) increased their trust score from last year – table 1, below sets these out. Significantly, only three companies (Bristol Water, South Staffs Water and Northumbrian Water) have now managed to increase their score for the second consecutive year; this kind of consistent, longer-term improvement is what is needed from all companies, as an indication that they are starting to turn things around, but they are still very much in the minority.
Table 1: Trust score by company, 2024-25, and change in the last year
| Company | 2024 Score | 2025 Score | Score difference |
|---|---|---|---|
| Southern Water | 5.74 | 5.08 | -0.66 |
| Yorkshire Water | 6.50 | 5.96 | -0.54 |
| South West Wate | 5.42 | 5.13 | -0.39 |
| Thames Water | 5.12 | 4.74 | -0.38 |
| United Utilities | 6.57 | 6.23 | -0.34 |
| Cambridge Water | 6.77 | 6.50 | -0.27 |
| Dŵr Cymru Welsh Water | 6.86 | 6.66 | -0.2 |
| South East Water | 5.81 | 5.64 | -0.17 |
| Severn Trent Water | 6.61 | 6.45 | -0.16 |
| Wessex Water | 7.02 | 6.87 | -0.15 |
| Portsmouth Water | 6.83 | 6.68 | -0.15 |
| Affinity Water | 6.46 | 6.41 | -0.05 |
| Anglian Water | 6.46 | 6.45 | -0.01 |
| Essex & Suffolk Water | 6.81 | 6.89 | 0.08 |
| Northumbrian Water | 6.91 | 7.02 | 0.11 |
| SES Water | 6.63 | 6.76 | 0.13 |
| Hafren Dyfrdwy | 6.80 | 6.98 | 0.18 |
| Bristol Water | 6.70 | 6.90 | 0.2 |
| South Staffs Water | 6.70 | 6.95 | 0.25 |
| Total (England) | 6.25 | 6.03 | -0.22 |
| Total (Wales) | 6.86 | 6.68 | -0.2 |
| Total (England and Wales) | 6.28 | 6.07 | -0.21 |
However, as in previous years, the significant fall of the lowest trust scores (particularly Yorkshire Water and Southern Water) has meant that the overall score in England and Wales has reached its lowest ever level. This was as true in Wales as in England, with the overall trust score falling by the same amount in both countries.
Digging deeper into drivers of trust
In addition to this year’s Water Matters, wanting to understand in more detail what was driving the change in customers’ trust scores, we undertook additional driver analysis to answer this question.
Table 2**, shows the variables from the survey which, taken together, have had the greatest relative importance in shaping trust scores among water customers:
Table 2: Top 5 key drivers of trust, by relative importance
| Rank | Driver | Relative importance |
|---|---|---|
| 1 | Agree that your company cares about the service it provides | 0.428 |
| 2 | Satisfaction with what your company does to protect the environment | 0.214 |
| 3 | Overall satisfaction with water supply | 0.091 |
| 4 | Overall satisfaction with wider water / sewerage services | 0.082 |
| 5 | Satisfaction with what your sewerage provider does to clean waste water | 0.059 |
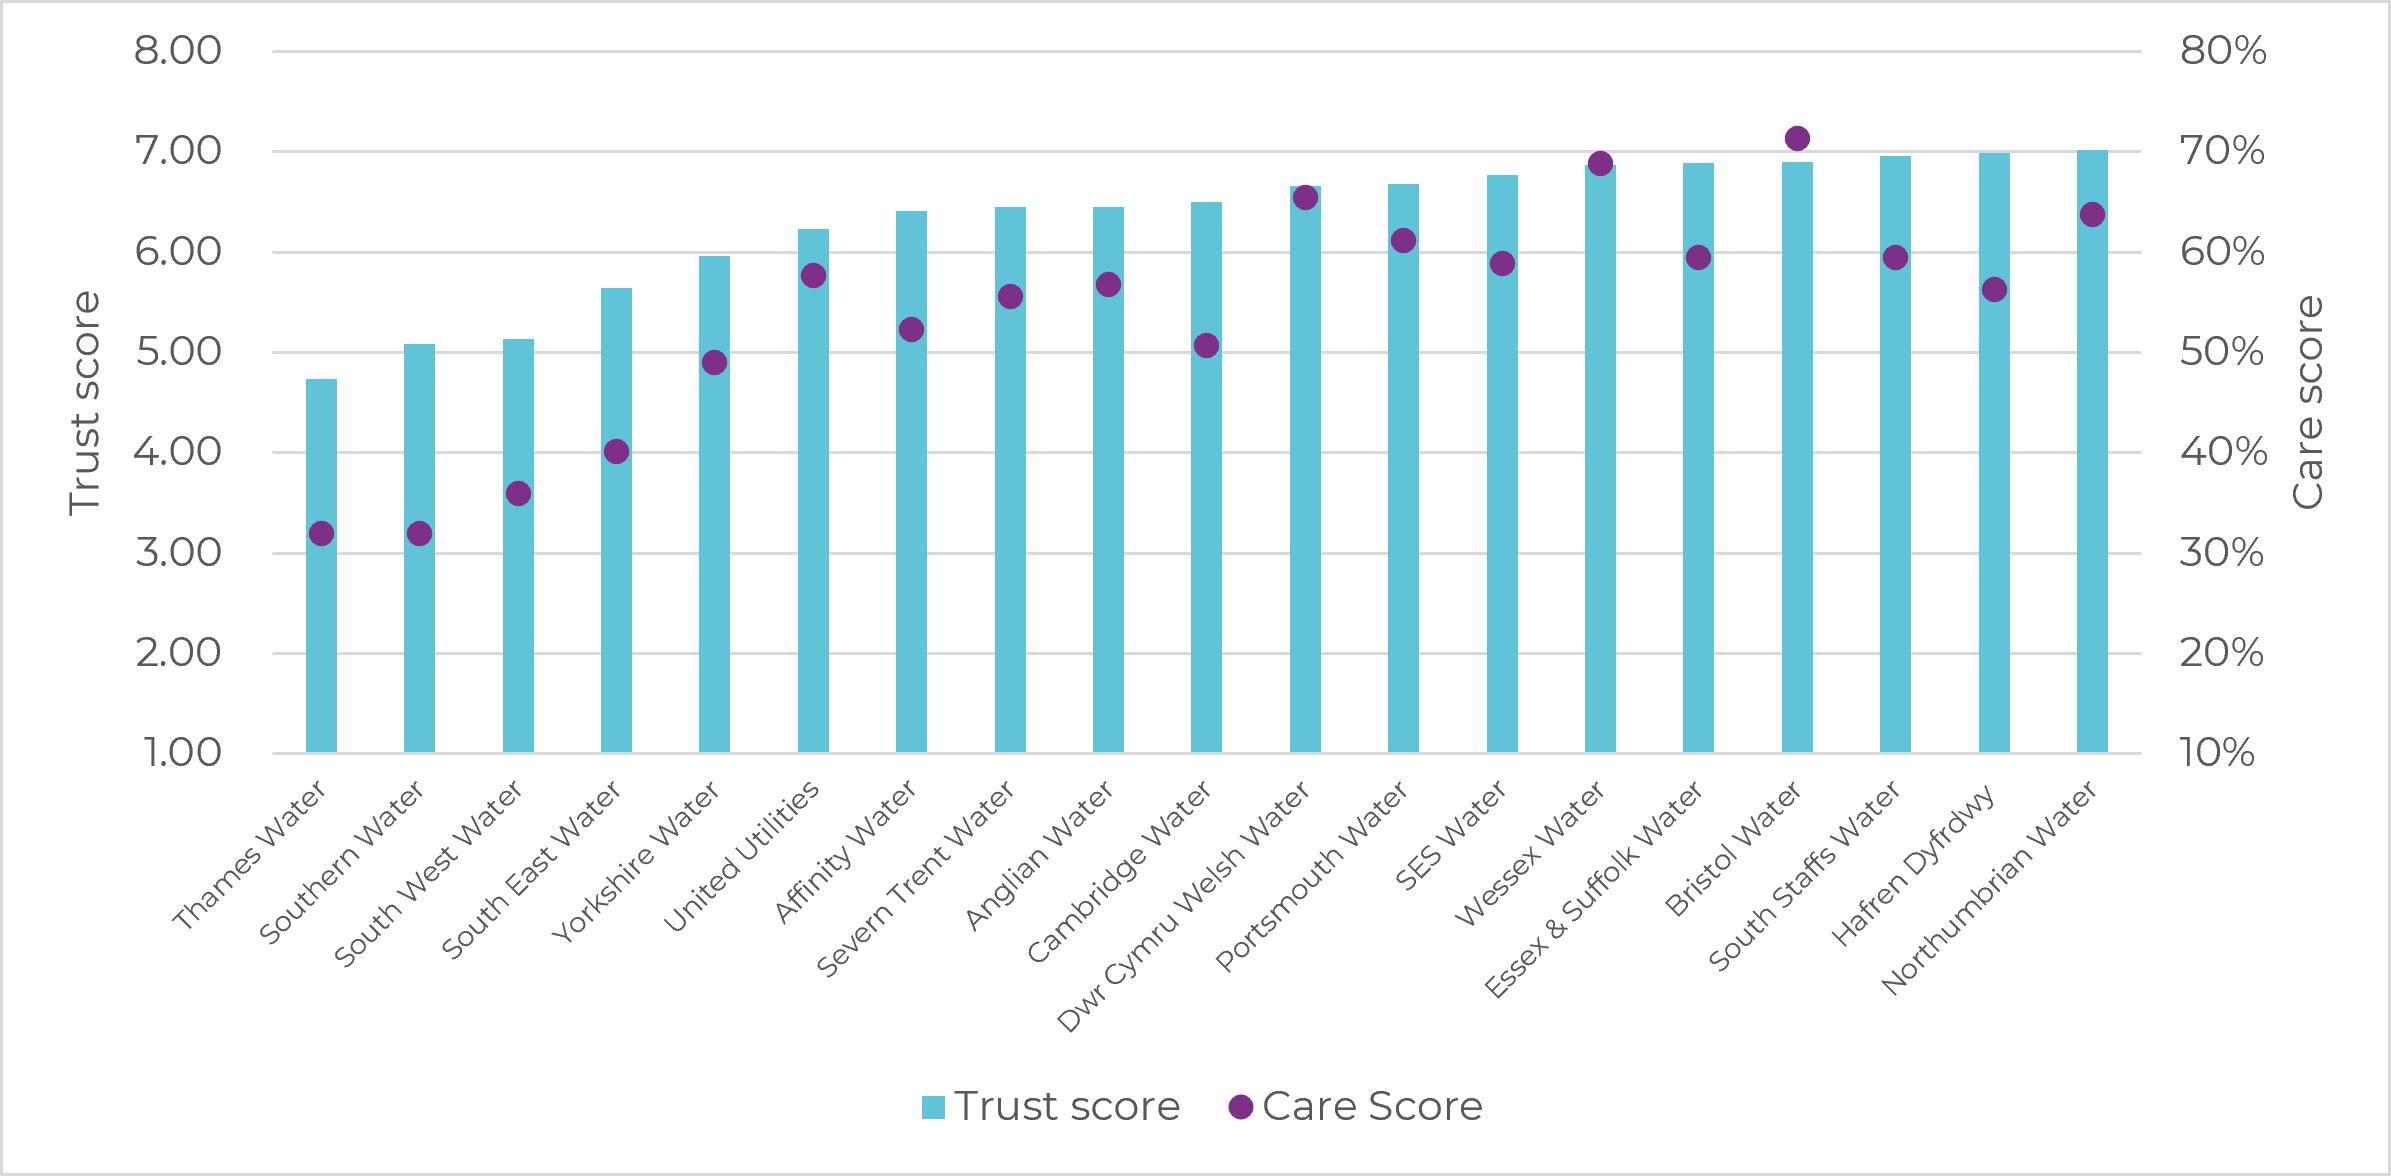
As this shows, perhaps unsurprisingly, whether or not respondents felt that their company cared about the service it provides was the single most decisive factor in shaping trust. This was far and away the largest driver of views on trust, both nationally and at an individual company level.
As figure 3, below, shows, there is a significant correlation between this year’s trust and care scores when the two are mapped onto one another. If customers feel that their company does not care about the service it provides, then their trust is likely to fall as a result – and vice versa.
The second most significant driver of trust in this year’s Water Matters was satisfaction with companies’ environmental performance. This metric has also fallen steeply in recent years in line with trust: satisfaction with what companies do to protect the environment was at a record low in this year’s Water Matters, with 37% of customers either fairly or very dissatisfied.
**Relative importance is measured by R-square, which tracks the strength of the relationship between a linear model (in this instance, trust) and the dependent variables, on a score between 0-1, where 1 is a 100% correlation
Additional insight on trust from our customer panels
These findings largely echo our June Spotlight survey from CCW’s Water Voice communities, which also looked at trust, and also found that many customers feel ignored by their company: of the various trust statements tested, people were least likely to agree with, ‘I trust my water provider to listen to customers before making important decisions that affect me’ (32%).
The same survey showed that panel members want to be more involved in these decisions, with almost half (48%) saying knowing where money from bills is being spent would most help them judge whether their water provider is being run responsibly, and a very significant 93% of them believing customers should have a say in decisions that could have a significant impact on their bills, the services they receive and the environment. We will be assessing how water companies are demonstrating their involvement of consumers in decision making and engaging with their feedback, as part of Ofwat’s new Consumer Involvement in decision making rule.
With this year’s Water Matters showing that a record low of just 46% of customers in England and Wales felt their company communicated well about its services and plans, there is a real opportunity for water companies to tackle low trust by improving communication. Indeed, this was an explicit theme of feedback from our Water Voice panel members: ‘I think they could do better at communicating about any changes or disruptions.’
Conclusion
The signs of trust being rebuilt by the majority of companies last year have not been sustained in this year’s Water Matters, with many of those companies seeing their trust levels fall again this year – although some companies saw steeper declines than others. The long-term, 10-year trust scores for nearly every company are now downward for the first time, as negative perceptions have been allowed to bed in.
At its core, falling trust is a reflection of a belief that water companies do not care about their service provision or their customers; this has been magnified by perceptions of pollution and poor environmental performance, and a lack of communication about how these issues are being addressed.
This year, for the first time, our Water Voice panels have given us additional insights into customer experiences of trust, alongside Water Matters. Trust depends on transparency and performance: community members want clearer information on where the money they spend on water bills goes, environmental performance and how providers are being run. As our recent research on customers’ understanding of company finances shows, where competence or integrity are questioned, customers become more attentive to financial information when it is presented to them and more likely to notice or listen to wider discussion about company finances.
We know that changing customer perceptions can take time, but a lot more work is needed by companies to turn things around. It is not acceptable to see a further move in the wrong direction. Companies need to increase their efforts to address the drivers of falling trust, such as poor communication or perceptions of substandard environmental performance.
We will be continuing to track how these trends develop in the next wave of Water Matters, to be published in spring 2027. In the meantime, the next of the ‘Mini Matters’ summaries from this year’s report will be looking specifically at issues of bills and affordability.