
Water Matters 2022

Household customers’ views of their water and sewerage services
Our annual Water Matters survey tracks the views of household customers on the services they receive from water companies in England and Wales.
Foreword
It’s been a difficult time for many households in recent years. People’s personal finances have been affected by a volatile economy, the impact of a pandemic and the soaring cost of living – including eye-watering energy costs.
Our Water Matters tracker now spans a period of 12 years, giving insight into how customers’ views have changed. It is encouraging that throughout this time more than 90% of customers have been satisfied with their water supply. However, the economic climate has added to the pressures faced by households. That’s why this report takes a closer look at what has been happening over the last five years, especially in relation to the indicators of customers’ financial stability.1
All water companies provide support and financial assistance to customers who are struggling to pay their bills. We want to help the industry understand where to focus its attention to meet the challenges that people are facing. Companies have been working to improve this financial assistance.
However, the last few years has seen significant increases in the number of people who need help now, or who are feeling worried about the future. If companies lose sight of these shifts, there is a risk that people may suffer. One of the biggest concerns this year is that the majority of people with a disability, and households where people with a disability live, feel that their financial situation has worsened since last year.
In this report, we highlight the main changes so that companies can ask themselves whether they are targeting the right information to the right people. We would like the companies to come together to share their own experiences, especially their best practices, so that the industry as a whole can improve and nobody is left without support.
1 The accompanying data report shows the longer-term trends (pdf, 2MB)

Mike Keil, Senior Director of Policy, Research and Campaigning
Overview of Water Matters results
Please refer to the accompanying data report for a detailed analysis of the Water Matters results (pdf. 2MB).
Although levels of satisfaction are high in some areas, there is evidence to suggest that satisfied customers are generally becoming ‘less satisfied’ across the board. We explore this in more detail later in the report.
Key highlights2
- 92% of customers in England and Wales are satisfied with their water supply, which has been a flat trend over the last 12 years.
- Satisfaction with different aspects of water supply ranges from 95% – 65%. Customers’ views on colour and appearance of tap water, hardness/softness and water pressure, has improved since 2021. However, satisfaction with the reliability of water supply has decreased, but retains the highest rating of all aspects of this service.
- Overall satisfaction with sewerage services increased to 79% in 2022. (Not a significant change.)
- Satisfaction with aspects of the sewerage service ranged from 74% – 53%. There was a decrease in satisfaction with minimising sewer flooding (from 64% in 2021 to 61%).
- Satisfaction with value for money remained at 75% for water and increased from 76% to 78% for sewerage services.
- In 2022, 64% of people perceived their charges to be fair, which was an increase on 2021 (62%).
- The number of customers agreeing that their charges were affordable remained at 76%. However, the number who feel that their charges are unaffordable increased (12% in 2022 vs 10% in 2021).
- In 2022, 53% said their household finances had worsened over the last year, which was an increase from 2021 (34%). Only 36% felt their finances were unchanged, which was fewer than last year (58%).
- Only 63% of people in 2022 were confident that their water supply would be available in the longer term without restriction, down from 71% in 2021.
- 64% of people agreed that their water company cares about the services that they provide – which is higher than 63% in 2021, but not a significant change.
- In 2022, trust in water companies fell to 7.21 – down from 7.33 in 2021 – to reach its lowest score since monitoring began.3
- 71% of customers would be likely to contact their water company if they had a problem with their bill. This has increased since last year (69%) but is not a significant change. In addition, the number of people who said they actually contacted their company increased by 3% to 21% in 2022.
- There was a fall – from 78% in 2021 to 76% in 2022 – in the number of customers who were satisfied with the contact they had with their company. (Not a significant change.)
- Awareness of the extra help offered to people in vulnerable circumstances through water companies’ Priority Services Registers has fallen, from 49% in 2021 to 47% in 2022. (Not a significant change.)
- Average awareness of the financial support offered by WaterSure/WaterSure Wales4 has decreased from 13% in 2021 to 12% in 2022.
- There has been no significant change in overall satisfaction with customer services, although the number dropped from 78% in 2021 to 77% in 2022. This relates to frequency and content of bills, meter reading and payments.
- However, more people – 86% in 2022 compared to 84% in 2021 – were satisfied with their overall experience of water and/or sewerage services.
- More people – 51% in 2022 compared to 50% in 2021 – said that the communication from their water company was good. (Not a significant change.)
2 Unless we state otherwise, all comparable figures in the text are statistically significant. Information about the statistical significance of data in graphs will be provided on request. Please note, the statistical significance of a change will depend on the number of people who answer the question. Hence, smaller changes will be significant if a large number answer the question but not significant if only a small number answer the question.
3 Question is rated on a scale from 1 to 10, where 1 is ‘do not trust them at all’ to 10 ‘completely trust them’. The figure reported here is an average of all trust scores.
4 WaterSure is a system set up to provide a reduction in charges for people on a low income and whose water is supplied by a meter. WaterSure Wales was previously known as Welsh Water Assist.
Table 1: Views in England and Wales in 2022
| Key |
|---|
| Not a statistically significant change |
| Statistically significant change |
| Measure | England | Wales |
|---|---|---|
| Satisfaction with overall water services | 92% | 95% |
| Satisfaction with overall sewerage services | 78% | 85% |
| Satisfaction with value for money of water services | 75% | 81% |
| Satisfaction with value for money of sewerage services | 77% | 84% |
| Perceive charges to be fair | 64% | 63% |
| Agree charges are affordable | 76% | 77% |
| Consider financial situation has got worse over last 12 months | 53% | 54% |
| Confident water supply will be available in long-term without restriction | 62% | 73% |
| Agree their water company cares | 64% | 76% |
| Level of trust in water company | 52% | 62% |
| Likely to contact if they have a problem with their bill | 70% | 74% |
| Actually contacted the company in the previous 12 months | 22% | 22% |
| Satisfaction with contact that was made in the last 12 months | 76% | 83% |
| Awareness of Priority Services Register | 47% | 45% |
| Awareness of WaterSure/WaterSure Wales | 12% | 12% |
| Overall satisfaction with customer services | 77% | 79% |
| Satisfaction with overall experience of water and sewerage services | 86% | 90% |
| Say that communication from company is good | 51% | 53% |
Introduction
People’s experiences and perceptions of the service provided by companies over the last 5 years is, in many cases, less encouraging than if we look at the 12-year trend5. This could be the result of a worsening economic climate, the recent negative publicity around storm overflows as well as changing expectations of companies. The most significant differences include:
- Areas where there are long-term upward trends in value for money, affordability and awareness of support available, fairness (in England only), and care (in England only) have flat trends over five years;
- The trends for trust in England and Wales are upwards over the long term but flat or downwards over the last five years.
- The trend of those that don’t know about WaterSure /WaterSure Wales but would like to is downwards over 12 years but flat over five years.
5Trend analysis evaluates the difference in signs between earlier and later data points, with each value compared to every value preceding it in the time series. The idea is that if a trend is present, the reported value will tend to increase constantly, or decrease constantly. For example, a value that dips over a few years but then rises across some of the years, will be considered as flat.
Table 2: Comparison of short and long-term trends
| Key |
|---|
| Areas where the trend over 5 years is worse in comparison to the trend over 12 years. |
| Area where the trend over 5 years is better in comparison to the trend over 12 years. |
| 5-year trend is in the same direction as the 12-year trend. |
| Wales | England | |||
|---|---|---|---|---|
| 12-year trend | 5-year trend | 12-year trend | 5-year trend | |
| Value for money of water services | ↑ | ↔ | ↑ | ↔ |
| Value for money of sewerage services | ↑ | ↔ | ↑ | ↔ |
| Agree that charges are fair | ↑ | ↔ | ↔ | ↔ |
| Agree that charges are affordable | ↑ | ↔ | ↑ | ↔ |
| Awareness of WaterSure / WaterSure Wales | ↑ | ↔ | ↑ | ↔ |
| Unaware of WaterSure / WaterSure Wales but would like to know more | ↔ | ↔ | ↓ | ↔ |
| Satisfaction with contact with company | ↓ | ↔ | ↔ | ↓ |
| Satisfaction with water services | ↔ | ↔ | ↔ | ↑ |
| Satisfaction with sewerage services | ↔ | ↓ | ↓ | ↔ |
| Agree that the water company cares | ↑ | ↔ | ↔ | ↔ |
| Trust the water company | ↑ | ↓ | ↑ | ↔ |
While the trends in companies’ individual scores do not necessarily reflect the same patterns as the industry overview set out in Table 2, generally speaking, for those negative differences that are highlighted in yellow on that table, companies will also see flat or worsening trends.
In addition, this year’s data reveals that people are becoming less satisfied in the services that are core to the customer experience.
Table 3: Examples of some significant key changes in customers’ perceptions of core aspects of company service across England and Wales
| Measure | Change in ‘Very’ and ‘Fairly’ customers* |
|---|---|
| Contact made over the last 12 months | |
| The ease of contacting the company | ‘Very’ satisfied – down by 5% ‘Fairly’ satisfied – up by 3% |
| The quality / clarity of information provided | ‘Very’ satisfied – down by 7% ‘Fairly’ satisfied – up by 6% |
| Feeling that the contact would be resolved | ‘Very’ satisfied – down by 7% ‘Fairly’ satisfied – up by 4% |
| Satisfaction with aspects of water services | |
| Taste and smell of tap water | ‘Very’ satisfied – down by 3% ‘Fairly’ satisfied – up by 4% |
| Reliability of supply | ‘Very’ satisfied – down by 4% ‘Fairly’ satisfied – up by 3% |
*All of these changes are significant, with the exception of the number of customers that are fairly satisfied with the ease of contacting their company.
In general, at an industry level and looking at several different results, the number of customers who are ‘very’ satisfied with certain individual aspects of their water or sewerage services has fallen, while those that are only ‘fairly’ satisfied has increased.
The shift from ‘very’ to ‘fairly’ satisfied and the differences between the five and 12-year trends could represent an erosion of sentiment which, if left unchecked, could be very damaging to customers’ perceptions of water companies. These industry level patterns will not always be reflected in companies’ individual scores and companies should examine their own results within this context, to see where they need to focus on improving their services.
Previously, we have highlighted how dissatisfaction is often linked to a package of experiences and if companies cannot deliver consistent, reliable services to customers, this can affect how people feel about wider issues such as trust, fairness of bills and value for money. In the current climate, however, the primary concern of many households will be to make ends meet, with other factors taking a back seat. To understand this further we focus on two indicators of customer financial stability: the current affordability of bills and whether the household financial situation has worsened in the last year.
Customer views on the affordability of their bills now
In the last five years, there have been some sharp changes in the general economy. However, over this time, the trends in both the number of customers who feel that their bills are affordable, and those who feel that their bills are unaffordable, has generally been flat.
Figure 1: Percentage of customers who feel that bills are unaffordable
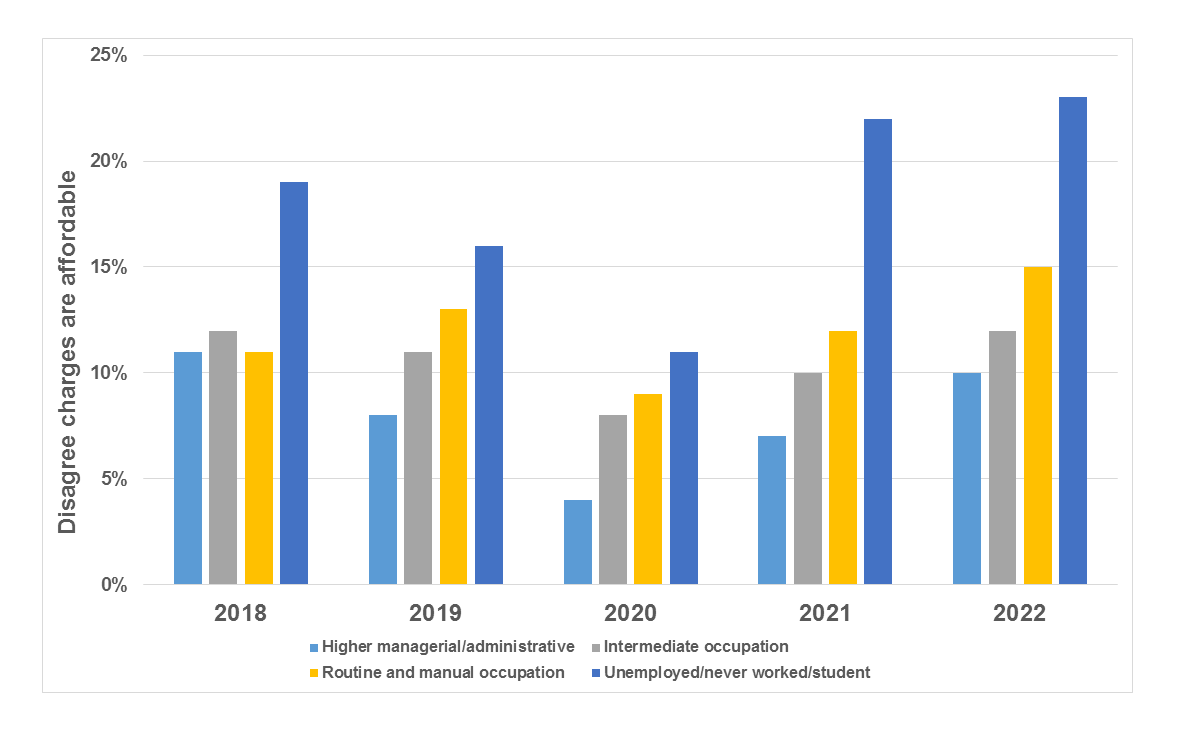
These changes are generally reflected across all socio-economic groups. Higher managerial covers occupations such as finance managers, teachers and social workers. Intermediate covers occupations such as retail and restaurant managers, nursery nurse, call-centre agent. Routine manual covers occupations such as HGV drivers, machinists and bar staff.
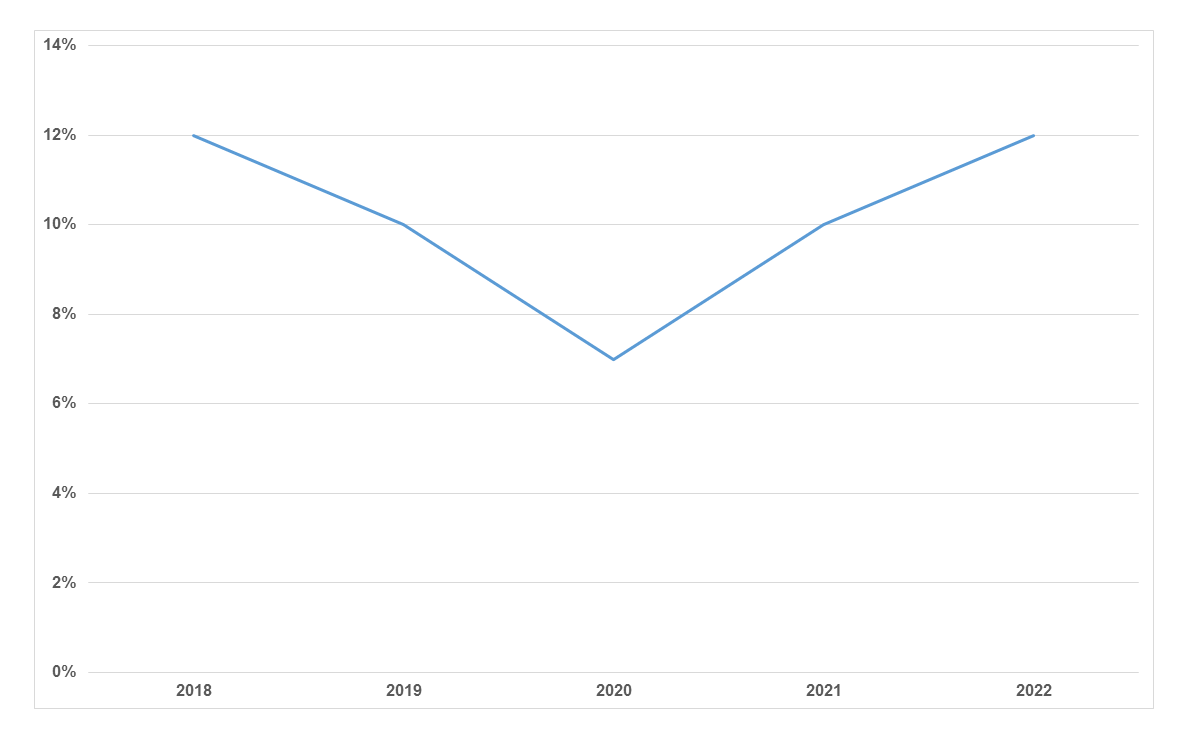
Figure 2: Unaffordability by socio-economic group
In the past, we have also highlighted how people with a disability, or households that include a disabled occupant, are significantly more likely to say that their bills are unaffordable. This continues to be the case this year.
Table 4: Disagree that their bills are affordable – people with a disability, or households that include people with a disability
| 2018 | 2019 | 2020 | 2021 | 2022 |
|---|---|---|---|---|
| 19% | 16% | 11% | 17% | 19%* |
*The change between 2021 and 2022 was not significant
There are also differences between ethnic groups, with mixed and Asian groups being more prone to financial vulnerability.
Table 5: Disagree that bills are affordable by ethnicity
| Key |
|---|
| Significant increase since previous year |
| Significant decrease since previous year |
| No significant difference since previous year |
| Year | White British / Irish | Other | Mixed | Asian | Black |
|---|---|---|---|---|---|
| 2018 | 11% | 12% | 28% | 26% | 17% |
| 2019 | 9% | 16% | 14% | 27% | 11% |
| 2020 | 6% | 5% | 20% | 17% | 2% |
| 2021 | 10% | 10% | 12% | 17% | 18% |
| 2022 | 11% | 18% | 29% | 26% | 19% |
The figures in table 5 show that, in 2022, mixed and Asian people are over twice as likely as others to feel that their bills are unaffordable. Furthermore, for all groups, with the exception of the black population, the numbers who disagree that their bills are affordable have significantly increased since last year.
Generally, we see bigger fluctuations in affordability across the groups of ethnic minority customers compared to the white customers. The white customer base is very large, which reduces the extreme fluctuations, but ethnic minority groups are still more likely to see fluctuations/sensitivity to the changes in affordability.
Customer views on how their finances have changed over the previous 12 months
While it is too early to say whether the latest views on affordability of bills are symptomatic of long-term shifts in customer views, Water Matters also pulls in data on the number of customers who feel that their household finances are worse than last year. We started collecting this in 2020 and there have been large increases, year-on-year, in the number of customers who feel their finances are worse.
Figure 3: Customers who feel their household finances worsened over the previous 12 months
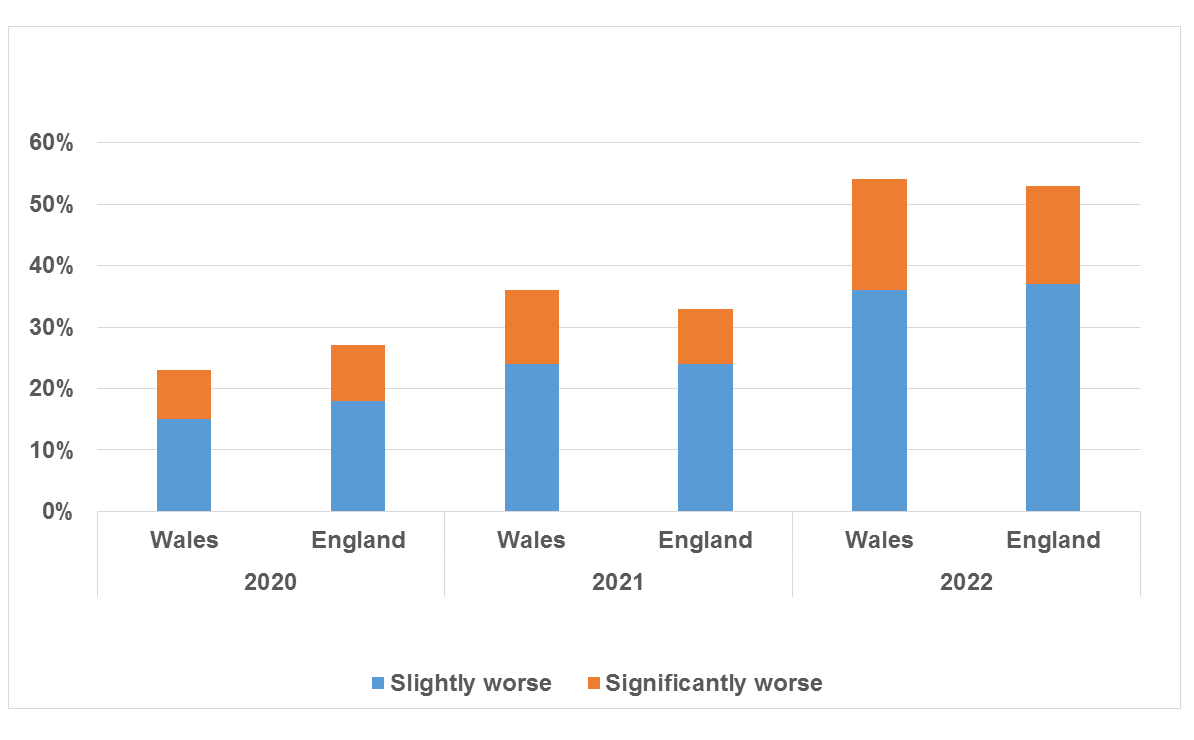
Figure 4: Customers who feel their finances are worse by socio-economic group
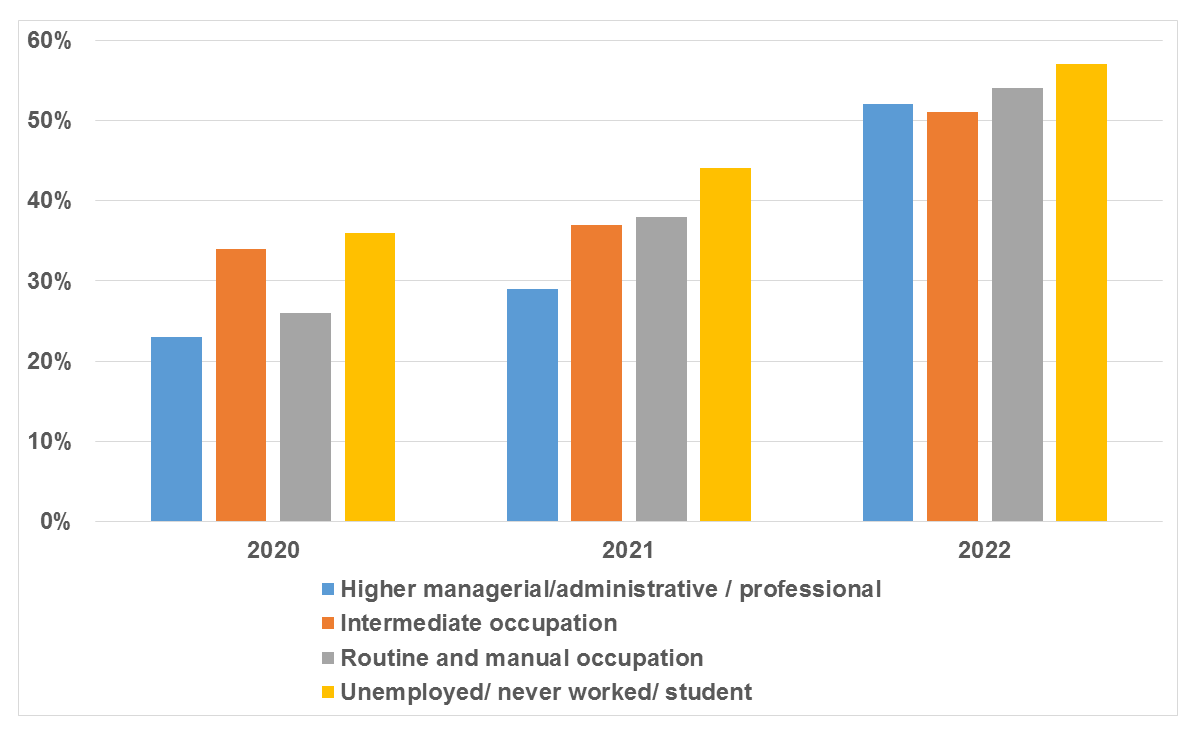
Table 7: Change in financial situation for people with a disability, or households that include people with a disability
| Feels that their situation has worsened over the last 12 months | ||
|---|---|---|
| 2020 | 2021 | 2022 |
| 32% | 45% | 61% |
This means that, in 2022, the majority of people with a disability, or households that include people with a disability, felt that their financial situation had worsened in the previous 12 months. It should be a priority of all companies to target these consumers with meaningful information about the support that they can receive.
Table 8: Changes in financial situation by ethnicity
| Key |
|---|
| Significant increase since previous year |
| No significant difference since previous year |
| Group | Feel that their financial situation has worsened | ||
|---|---|---|---|
| 2020 | 2021 | 2022 | |
| White / White Irish | 26% | 34% | 53% |
| Other | 27% | 27% | 57% |
| Mixed | 37% | 31% | 62% |
| Black | 20% | 33% | 43% |
| Asian | 38% | 31% | 55% |
These figures show that all sections of the population and ethnic groups are experiencing this increase in pressure on their finances. People who felt that their finances had got worse were nearly twice as likely to feel that their charges were unaffordable.
Overall, the data shows that a growing number of people feel that their bills are unaffordable now. In addition, there is also a growing number of people who feel that their finances have worsened over the last 12 months. They are at risk of feeling that their bills are unaffordable in the future, if they do not already feel this way. This suggests that many more customers may need support with bills in the future. Companies need to have the capability and capacity to respond to a potential future surge in people needing support.
Companies will need to make sure they get the right support mechanisms in place for all customers and this will include targeting information and communications.
Support and assistance for customers
We also looked at the three main measures from Water Matters that indicate how well water companies are supporting customers who are financially struggling. We compared the results with last year’s Water Matters data.
- More customers, whose financial situation had worsened since last year, said that they would be likely to contact their company if they needed help with their bill (an increase from 66% last year to 68%).
- 66% of these customers who are feeling the pinch were unaware of the possibility of company assistance if they had trouble paying their bills. This figure is unchanged this year.
- More customers reported that they were unaware of WaterSure/WaterSure Wales.
Given the unfolding cost of living crisis, we would expect to see an increase in contact with company and awareness of support schemes. The data indicates that companies need to do more to raise awareness of support for those who need it and to break down barriers that prevent customers from making contact.
Companies should promote schemes widely, in accessible language and formats. They also need to reduce the effort needed to apply for social tariffs. For example, customers may find it difficult to print off or complete pdf forms.
Ideally, customers should be able to apply for assistance or support via a communication channel that suits them. For offline customers this may mean a dedicated telephone number. However, if this is a chargeable call, this could deter customers in financial difficulty from getting in contact, undermining company aims and efforts. Some companies are already offering free phone numbers for customers to call and/or proactively calling people back.
Our Customer Engagement (CE) score, which we have tracked from 2014, incorporates people’s awareness of schemes and their views on the likelihood of contacting their water company.
We calculate our CE score by following the Principal Components Analysis methodology, which creates a single score from a combination of the following measures, each with the underlying theme of engagement:
- Likelihood of contacting their water company if they are worried about paying their bill
- Awareness and/or subscription to additional help/services
- Awareness and/or subscription to WaterSure/WaterSure Wales and other special tariffs
- Awareness of their right to revert for free/meter for free
- Whether they made contact with water/wastewater company.
Figure 5: Customer engagement score since 2014
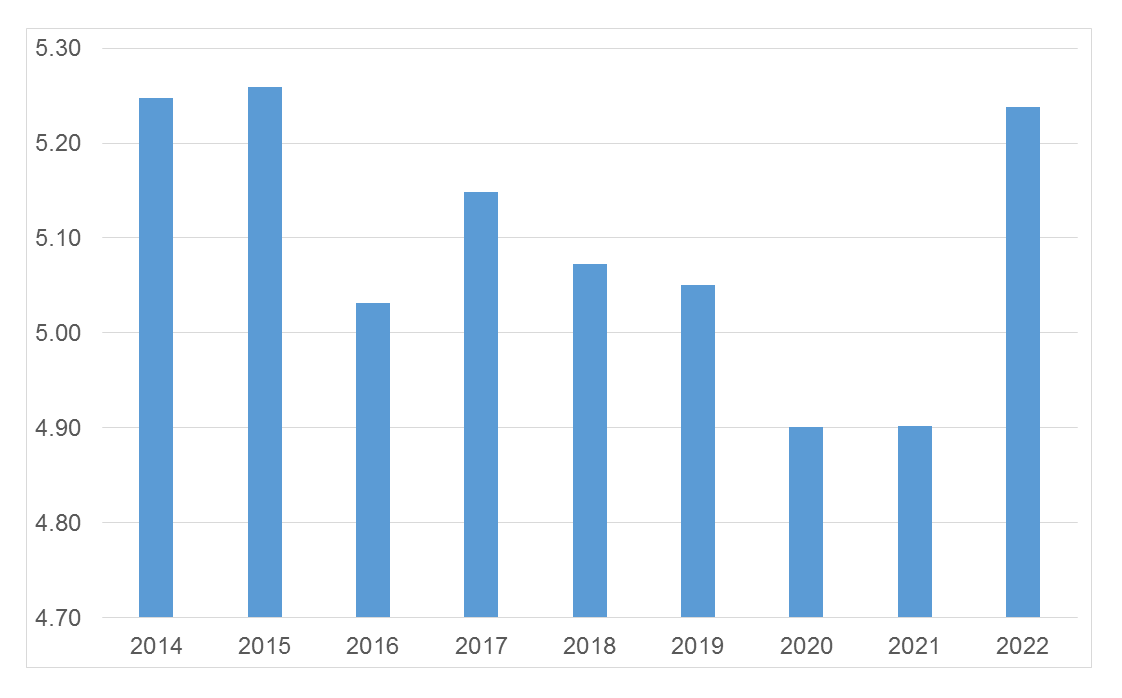
The recent rise in the financial pressures on households means it is important to make information available to people. This year saw an improvement in the direction of the CE trend, which is positive. Until this year, the trend in the customer engagement score was downward but now both the 9-year and 5-year trends are flat. This is because, in 2022, there were large increases in the CE score in both England and Wales.
CCW has supported the companies’ work in this area. We’ve ensured additional measures to support customers through the cost of living crisis were implemented. Our One Year on Report summarised the progress achieved since the publication of the recommendations in our independent review of water affordability. We will continue to work with companies to make progress.
Over the last year, we have:
- Established a new one-stop–shop webpage for help with bills. The page is typically attracting between 20,000 and 40,000 views each month. This is as much as 20 times the previous level of usage, in some cases.
- Collaborated with Water UK to launch a ‘Support on Tap’ campaign to promote the availability of financial help with bills. Advice was promoted through a range of media including an animation, social media content, podcast episodes and a leaflet to be circulated among the foodbank network. There was also high-profile coverage in the mainstream media.
To sum up…
In recent years, broadly speaking, the trends in customer views and preferences have been relatively flat. Although levels of satisfaction have been high in some areas, this year’s data suggests that people are becoming more negative – evidenced, in part, by the shift in ‘very’ satisfied customers to ‘fairly’ satisfied customers. Within this context, there has been an increase in both the number of people with affordability concerns and those whose finances have worsened over the previous 12 months.
Companies will need to continue to improve how they engage with their customers as financial situations worsen. They will need to focus on improving the awareness of financial assistance, including targeting their communications, where necessary. In addition, they should continue to deliver our recommendations and identify new ways to enhance support and increase the uptake of this assistance.
Companies will be able to use this year’s data to help identify areas they need to address. They should also share their experiences of the most effective ways of engaging with people – especially with those customers who are hard to reach and may be resistant to communication.
The figures relating to people with a disability are a particular concern to us. We would like companies to consider these findings and identify what action can be taken to increase awareness and take-up of financial assistance among this group. We will ask companies to report progress on this to us in our meetings with them on affordability during the coming year.
This is the time for companies to take action if they are to prevent their satisfaction and engagement scores from falling. All areas of their service are important to customers but, given the current economic climate, helping to improve customer resilience to financial vulnerability is a key priority.